The AI adoption curve and where your users sit
The AI adoption curve maps who adopts your AI feature and when. Design for the skeptical majority in the middle, not early adopters, to win retention.
 Shahriar P. ShuvoAI Adoption & Trust7 min read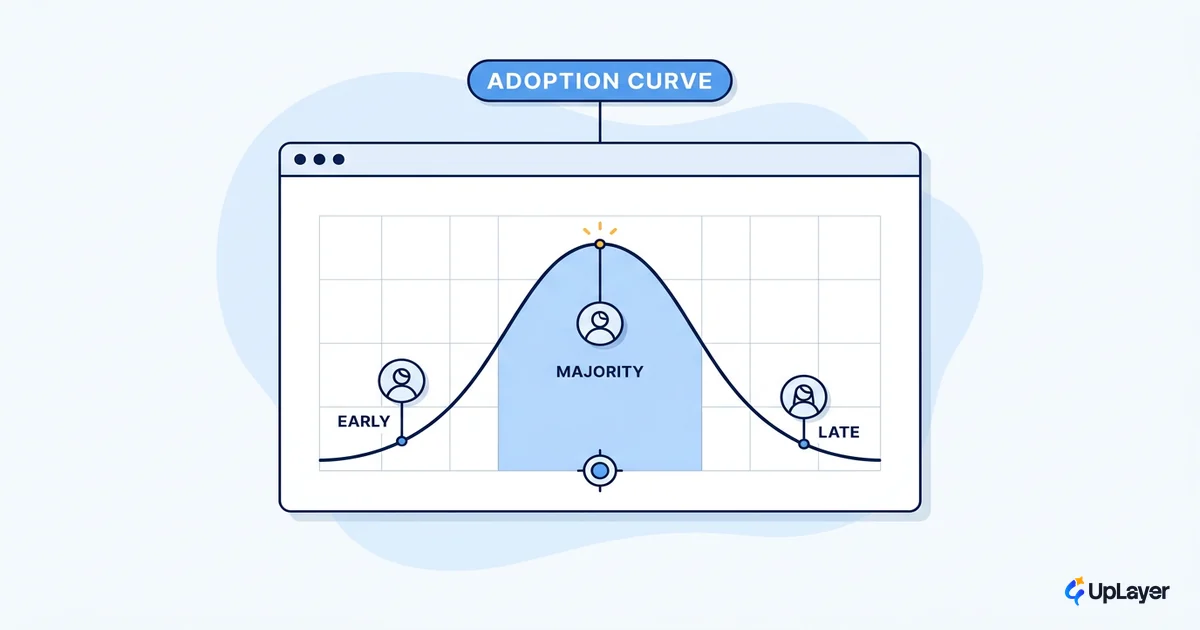
Here is the trap. You ship an AI feature, your power users adopt it within days, and you call it a win. The problem is that those users were always going to try it. They prove nothing about whether the feature earns its place. The people whose behavior actually moves your retention number, the skeptical majority in the middle, never showed up. The AI adoption curve is the map that explains why, and it is the difference between a feature that compounds into retention and one that quietly becomes the thing nobody opens.
Most teams read the curve as a marketing launch story: get from the enthusiasts to the mass market. That framing misses the point inside a product you already own. The curve is really a design and retention problem. If you want to increase AI adoption in a way that shows up in the numbers, you design for the skeptic in the middle, not the enthusiast at the front. This post maps the curve onto a single AI feature, shows where your users actually sit, and gives you a way to decide what to build for whom.
What is the AI adoption curve
The AI adoption curve is the technology adoption curve applied to AI: a model of who adopts a new capability and in what order, plotted over time as an S-shaped wave. It comes from Everett Rogers' diffusion of innovations, which splits any population of adopters into five categories by how readily they take on something new. Adoption starts slow with a few risk-tolerant users, accelerates through the majority, then tails off with the holdouts.
Mapped onto an AI feature in your product, the five categories look like this.
| Segment | Share | How they treat your AI feature |
|---|---|---|
| Innovators | 2.5% | Turn it on the day it ships. Tolerate bugs. Will use it even if it's bad. |
| Early adopters | 13.5% | Try it fast, give feedback, evangelize internally. Forgiving of rough edges. |
| Early majority | 34% | Wait for proof. Adopt once it's clearly useful and clearly safe. |
| Late majority | 34% | Skeptical by default. Adopt only when staying on the old way costs them. |
| Laggards | 16% | Avoid it. Adopt last, often only when there's no alternative. |
The first two segments, the innovators and early adopters, are roughly 16% of your users. The early and late majority together are about 68%. That 68% is the part of the curve where the technology adoption curve for AI either turns into durable usage or stalls out.
The AI adoption lifecycle inside one product
Treat the curve as the lifecycle of one feature, not the launch of a whole product. A single AI feature walks the same path your company once walked, just compressed and visible in your own analytics. That is the AI adoption lifecycle: the same five segments, observed inside one product over weeks instead of years.
Each stage maps to behavior you can already see in the adoption metrics you track. Watch the shape of the curve, not the raw count.
- Innovator stage: a spike of usage from a handful of accounts in the first days. Easy to mistake for traction.
- Early-adopter stage: steady usage from a small, engaged group; feedback volume is high relative to user count.
- Early-majority stage: the inflection point. Usage either broadens to typical accounts or it doesn't. This is where adoption becomes real.
- Late-majority stage: adoption among accounts that were visibly reluctant, usually after a default changed or the old path got friction.
- Laggard stage: the long tail; rarely worth engineering for directly.
The AI adoption stages matter because each one demands a different response. Polishing for innovators when you're stuck at the early-majority inflection is wasted effort. The stage tells you what the next build should be.
Where are most SaaS users on the AI adoption curve
Most of your users sit in the early and late majority, and they are more skeptical than the people who built the feature. Start with the macro number: 78% of organizations reported using AI in 2024, up from 55% the year before, per Stanford's AI Index. That sounds like everyone is on board. But company-level usage is not the same as your specific feature's adoption, and the individual users inside those companies are far more wary than the headline implies.
The gap between builders and users is wide and measured. Pew Research found people are far more skeptical than the experts building it:
47% of AI experts say they are more excited than concerned about the increased use of AI in daily life. Among the public, that share drops to 11%. Pew Research Center, 2025
That four-to-one gap is the curve in one statistic. The people designing AI features sit at the front; the people who decide whether the feature retains them sit in the skeptical middle, which is exactly where retention is won or lost. The boundary between the early adopters and the early majority is the hardest crossing on the curve. Theorists named it the chasm: the discontinuity where a feature with enthusiastic early use fails to reach the cautious majority. Most AI features die in that gap.
Why early adopters flatter your AI feature
Early adopters will use almost anything. That is their defining trait, and it makes them a poor signal for whether an AI feature is good. They adopt to stay ahead, they forgive rough edges, and they fill in the gaps your design left open. Reading their enthusiasm as product-market fit is the single most expensive mistake in AI product work.
WARNING
Enthusiast usage is not adoption. If the only people using your AI feature are the ones who would try anything, you have a demo, not a product. The metric won't move until the skeptical majority adopts, and they need reasons your early adopters never asked for.
This is not a small risk. Gartner predicts at least 30% of generative AI projects will be abandoned after proof of concept by the end of 2025, citing escalating costs and unclear business value among the causes. A proof of concept that only ever wins over innovators looks alive right up until someone asks what metric it moved. The honest answer, in that case, is none, because the 68% who would move the metric never adopted.
How to design for early vs late AI adopters
Design for early versus late AI adopters by treating them as two different products with two different value equations. Early adopters want power, speed, and control. The skeptical majority wants trust, sensible defaults, reversibility, and a visible reason the feature is worth changing their habit for.
| Design choice | For early adopters | For the skeptical majority |
|---|---|---|
| Default state | Off, opt-in, configurable | On where safe, with a clear off switch |
| AI output | Raw, fast, terse | Explained, with a visible "why" and a source |
| Errors | Tolerated, reported | Caught before the user sees them; reversible |
| Trust signals | Optional | Required: confidence, citations, an undo |
| Human-in-the-loop | Skippable | Default on high-stakes actions |
The pattern that gets the majority across the chasm is trust made visible. NIST's framework lists the trustworthy-AI characteristics that the cautious adopter is implicitly checking for: valid and reliable, safe, accountable, transparent, and explainable. Those are not safety features bolted on at the end. For the majority, they are the adoption mechanism. A skeptic adopts a feature that shows its work and lets them undo it; they ignore one that asks for blind faith. The same principle runs through the UX patterns that earn trust in supportive AI.
Before you ship the next iteration, run it against a skeptic-readiness check. If it fails, you're building for the 16%, not the 68%.
skeptic_readiness_check:
  default_is_safe:        # can a cautious user turn it on without risk?
  output_is_explained:    # does the feature show why, not just what?
  action_is_reversible:   # can they undo the AI's change?
  trust_signal_visible:   # confidence, source, or citation shown?
  human_in_loop_on_risk:  # high-stakes actions require approval?
  reason_to_switch_clear: # is the payoff obvious to a non-enthusiast?

# Pass = at least 5 of 6 true. Fewer than 4 means you are
# still designing for innovators, and the metric will not move.
Turning the AI adoption curve into a build decision
The most useful thing the curve does is tell you what to kill. If a feature reaches innovators and early adopters and then flatlines, that flat line is a verdict, not a temporary dip you can polish your way out of. A feature stuck below the chasm is not under-marketed; it usually lacks a reason for the cautious majority to adopt it. Sometimes the right move is to redesign for the skeptic. Sometimes the right move is to cut it and spend the engineering on a feature that can actually clear the gap.
That decision should be made on a projected number, not a gut read. Tie each segment of the curve to the metric you already track, then ask which build moves it. A feature that will only ever serve innovators rarely justifies its maintenance cost. One that earns the early and late majority changes activation, retention, or expansion in a way you can see. Read this way, the AI adoption curve stops being a launch diagram and becomes a prioritization tool: it ranks what to build by who it can actually reach, and it gives you permission to stop building the things that only ever flatter your most forgiving users.
TIP
Want to know which AI feature will reach your skeptical majority and move a metric you already track, before you build it? How the AX Audit works.