AI adoption metrics and what to track
The AI adoption metrics that prove a feature is adopted and trusted: usage depth, repeat rate, correction rate, and the vanity numbers to stop reporting.
 Shahriar P. ShuvoAI Adoption & Trust8 min read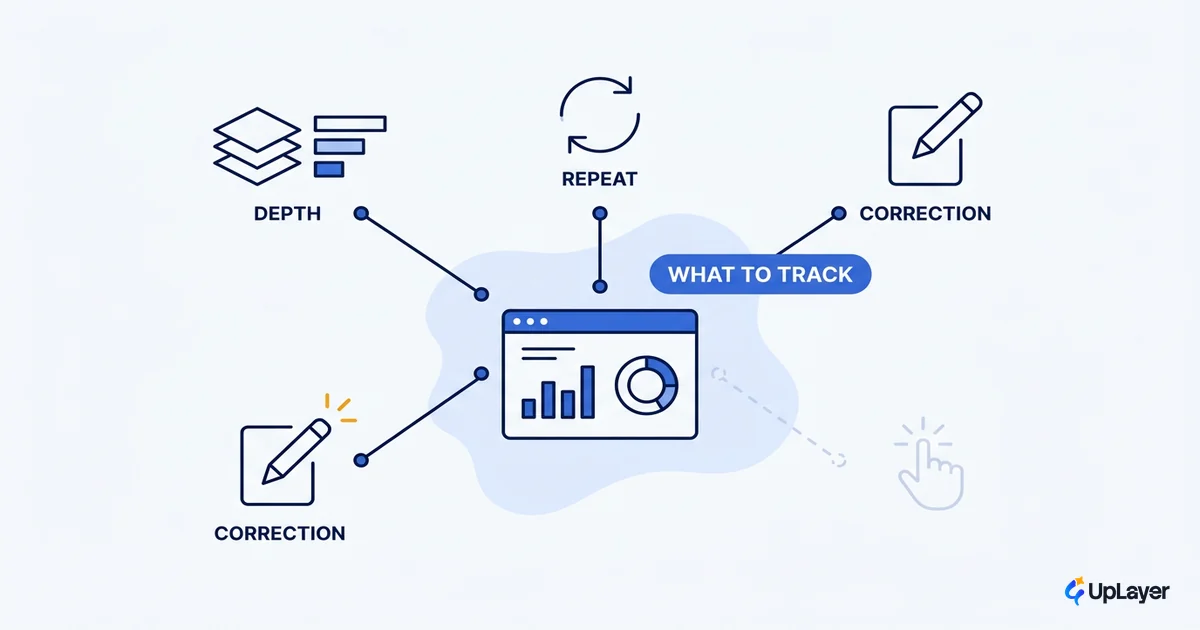
You shipped the AI feature. The dashboard is green. People are clicking. And you still cannot answer the only question your board actually asked: is anyone trusting this thing, and did it move a number we care about. Most AI adoption metrics measure curiosity, not adoption. They light up the first time a user pokes the feature and then never tell you whether that user came back, went deeper, or quietly started editing every output by hand.
That is the trap. Usage is not adoption, and adoption is not trust. An AI feature is the one place in your product where a user can click the button, read the answer, distrust it completely, and fix it themselves, and every usage chart you own will still show green. If you want to know whether you should keep building on this feature or kill it, you have to track the small set of numbers that separate "tried it" from "relies on it." This is the measurement companion to how to increase AI adoption: you cannot increase what you are not measuring honestly.
What metrics measure AI adoption (and what they don't)
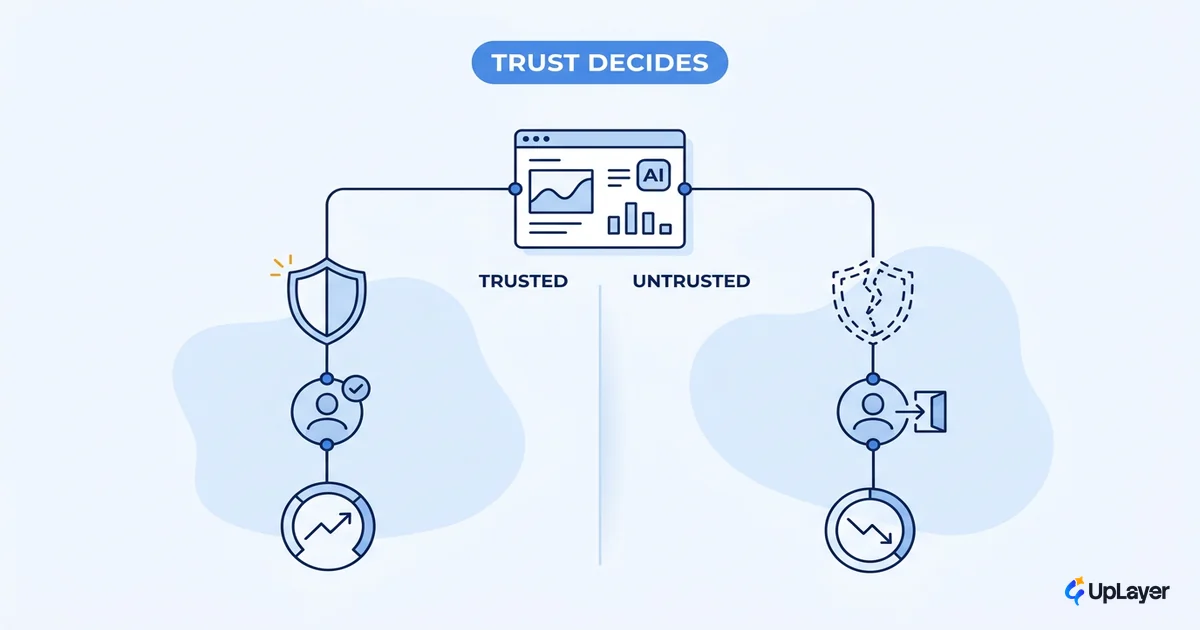
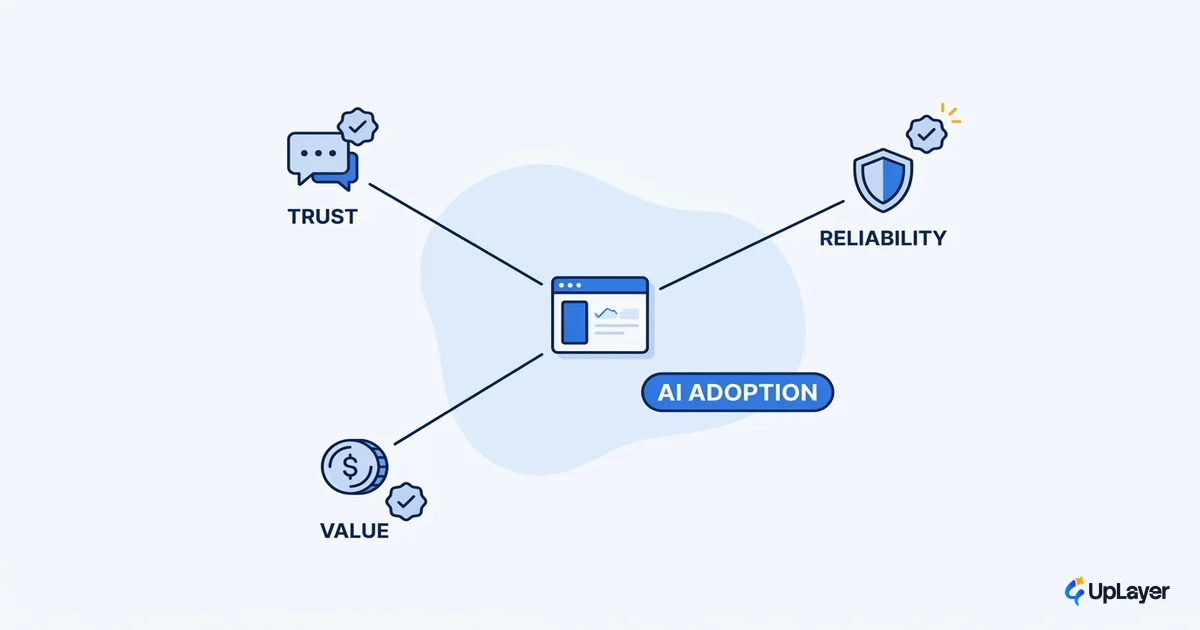
AI adoption metrics fall into three layers: usage, trust, and business impact. Most dashboards only show the first one, which is why they lie. Usage tells you a feature was touched. Trust tells you the output was accepted. Business impact tells you it changed a number you already report. You need all three, and you need them in that order, because a feature can score perfectly on usage and fail on the other two.
Start with the layer everyone gets wrong: reach. A feature that 100% of users tried once is not adopted, it is sampled. The product-analytics canon already separates these. Feature adoption is best read as a measure of user activation, not a one-time click. The standard adoption-rate formula is the feature's monthly active users divided by total logins in the period, and the average feature adoption rate for SaaS products sits near 24.5% in Userpilot's benchmark data. The useful move is not to chase that 24.5%. It is to set your own pre-launch baseline and measure the delta, because adoption rates swing wildly by feature complexity and audience.
| Layer | The metric that means something | The vanity twin to stop reporting |
|---|---|---|
| Usage | Adoption rate, usage depth, repeat rate | Total clicks, "tried once" reach |
| Trust | Correction rate, override rate, escalation rate | Raw model accuracy in isolation |
| Impact | Lift on a metric you already track | Total prompts served, AI sessions |
The three AI adoption metrics that prove a feature is working
Three numbers prove an AI feature is being adopted and trusted: usage depth, repeat rate, and correction rate. Depth and repeat come straight from product-analytics practice. Correction rate is the one that is specific to AI, and it is the one almost nobody reports.
Usage depth is how far a user gets inside the feature, not whether they opened it. For an AI summarizer, depth is "summarized a real document," not "viewed the summarize button." Repeat rate is the share of users who come back to the feature in a later session. A user who used it once and never returned did not adopt it, whatever the first-touch chart says. Correction rate is the share of AI outputs a user edits, overrides, rejects, or escalates to a human before using. It is the cleanest trust proxy you have, because it measures what users do when they think the model is wrong.
Feature adoption rate  = (feature MAU / total logins in period) × 100
Repeat rate            = (users active in feature this period
                          who were also active last period) / last-period users
Correction rate        = (AI outputs edited, overridden, or rejected)
                          / (total AI outputs delivered)

Read together: high adoption + high repeat + LOW correction = trusted and adopted.
High adoption + high correction = curiosity that will churn.
A rising correction rate is a leading indicator of churn, not a quality footnote. If users keep fixing the output, they are doing the work the feature promised to do, and they will eventually decide the feature is not worth the friction. This is why measuring usage without measuring correction is how teams build user trust in AI features on paper while losing it in practice.
Correction rate: the AI adoption KPI nobody reports
Correction rate is the AI adoption KPI that separates a trusted feature from a tolerated one, and most teams do not even instrument it. It is the single number that tells you whether users believe the output. A feature with 80% adoption and a 60% correction rate is not adopted, it is a draft tool that users are politely cleaning up after.
WARNING
If you ship an AI feature without a correction-rate baseline, you have no way to tell trust from churn risk. A green usage chart with a quietly climbing correction rate is the most expensive false positive in your product.
Track correction, override, and escalation as a family. Correction is the user editing the output. Override is the user discarding it and doing the task another way. Escalation is the user routing past the AI to a human. All three say the same thing in different volumes: the model was not trusted here. None of them appear on a standard adoption dashboard, which is exactly why the standard adoption dashboard cannot tell you whether your AI feature is working.
The AI usage metrics to stop reporting
Some AI usage metrics demo well and prove nothing. They are easy to pull, they always go up and to the right, and they are the first thing a team reaches for when the board asks how AI is going. Name them and stop reporting them.
| Vanity metric | What it hides | Report this instead |
|---|---|---|
| Total prompts served | Whether anyone came back | Repeat rate |
| Total clicks / "tried once" reach | Whether anyone went deep | Usage depth |
| Model accuracy in a lab | Whether users trust it in the wild | Correction rate |
| AI sessions count | Whether a real metric moved | Lift on the tracked business metric |
The pattern is consistent. Every vanity metric measures the feature's effort and none of them measure the user's belief or the business outcome. If removing a metric from your report would not change a single decision you make, it was never a KPI. It was decoration.
How do you track AI feature adoption end to end
You track AI feature adoption in four steps: pick one business metric, set its baseline before launch, instrument depth and repeat and correction, then watch the delta against that baseline. The order matters. Most teams instrument after launch, which means they never have the pre-launch number to compare against, and a delta with no baseline is just a chart.
- Pick the one metric the feature is supposed to move. Activation, time-to-value, retention, expansion. One, not five.
- Set the baseline before you ship. Record where that metric sits today, with no AI feature live.
- Instrument the three adoption signals. Depth, repeat, and correction, segmented by cohort so you can see who adopts and who bounces.
- Compare projected against actual. You projected a lift when you decided to build. Now measure the real one.
For a single roll-up number, you can fold the usage side into a composite Product Engagement Score that averages adoption, stickiness, and growth, where stickiness is the familiar DAU/MAU ratio. That gives you one trend line for the usage layer. Keep correction rate and the business-metric delta separate, because those are the two numbers that decide whether the feature stays. This is the loop that turns a shipped feature into reducing churn with AI features users trust: adopted and trusted features retain, sampled-and-corrected features do not.
TIP
The fastest way to know which metric your AI feature should move, and whether it is moving it, is an outside read on the instrumentation. UpLayer's audit ties one AI feature to one number you already track. How the AX Audit works.
Which KPIs show AI adoption is working
The KPIs that show AI adoption is working are always paired: one input metric and one output metric. Depth and repeat are the inputs. A lift on the business metric is the output. If the inputs are rising and the output is flat, the feature is being used and is moving nothing, which is the most common failure mode in the market.
78% of organizations reported using AI in 2024, up from 55% the year before, according to Stanford's 2025 AI Index.
That number is the whole point. Access to AI is now near-universal, so a rising adoption count proves nothing on its own. Plenty of teams can show that AI is in the product and almost none can show that a user trusts it or that it changed a tracked metric. For the macro picture behind your own dashboard, the AI adoption statistics worth knowing tell the same story: adoption is everywhere, proven value is rare. Pair every adoption KPI with the business KPI it is supposed to move, and the gap between them becomes your roadmap.
The teams that win the next two years will not be the ones with the highest AI usage charts. They will be the ones whose AI adoption metrics show depth, repeat use, and a falling correction rate against a business number they were already accountable for. Track those, stop reporting the rest, and the feature either earns its place or tells you to kill it. Either answer is worth more than a green dashboard that means nothing.