AI adoption statistics every SaaS team should know
AI adoption statistics for 2026 from primary sources with dates: real adoption rates, usage data, growth, and the trust gap that decides your feature.
 Anamoul RoufAI Adoption & Trust8 min read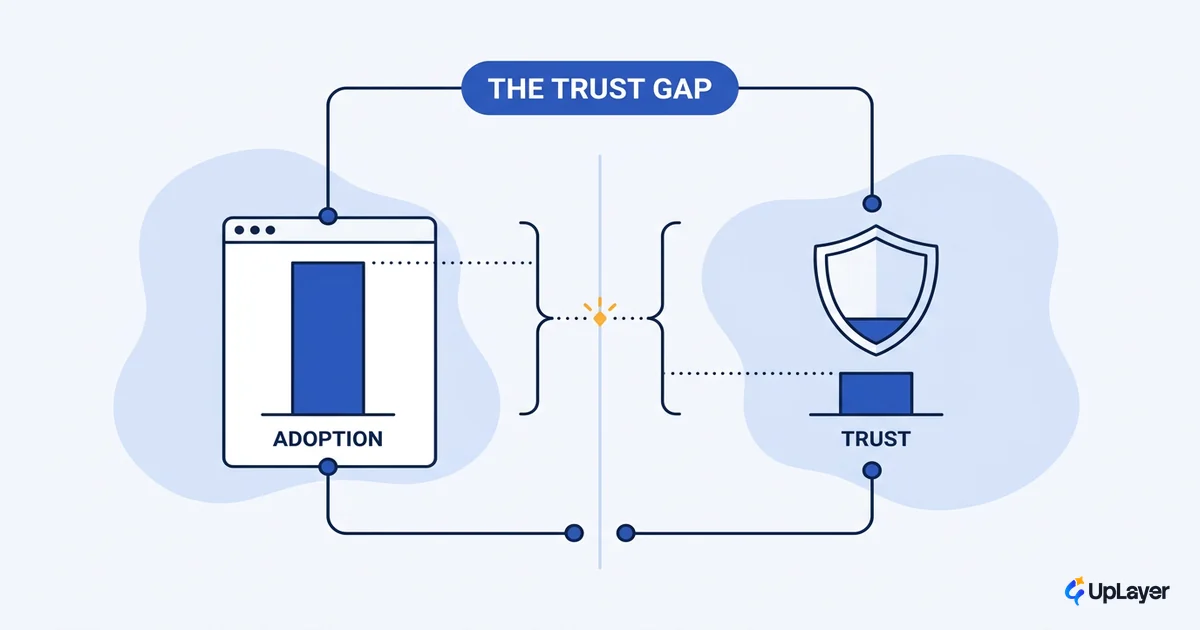
Adoption is the wrong thing to worry about. By every credible measure, companies are already using AI. The number that decides whether your feature survives is trust, and that one is still low. Most of the AI adoption statistics you will find online report the first number, skip the second, and never put the two side by side. That gap is the whole story for a product team.
We maintain this set differently. Every figure below names its primary source and its date, so you can lift it into a board deck or a strategy doc without getting fact-checked into a corner. We also read the numbers the way a founder has to read them: not "look how big AI is," but "given this, what do I build, and what do I refuse to build?" That decision is the work, and it is the subject of our cornerstone on how to increase AI adoption.
The short version: adoption is effectively solved, trust is not, and the trust number is the one tied to the metric you actually track.
The headline AI adoption statistics for 2026, with sources
Here is the load-bearing set, each figure with its primary source and date. These are the numbers worth citing.
| Statistic | Figure | Primary source (date) |
|---|---|---|
| Organizations using AI | 78% in 2024, up from 55% | Stanford HAI, 2025 AI Index |
| US firms using AI (firm-weighted) | ~18% end of 2025 | Federal Reserve / Census BTOS, Apr 2026 |
| US firms using AI (employment-weighted) | ~78% | Federal Reserve, Apr 2026 |
| US companies using generative AI | 95%, up 12 points in a year | Bain & Company, 2025 |
| Developers using or planning to use AI tools | 76%, up from 70% | Stack Overflow Developer Survey, 2024 |
| Developers who trust AI output accuracy | ~43% (31% distrust) | Stack Overflow Developer Survey, 2024 |
| US public more concerned than excited about AI | 51% | Pew Research Center, Apr 2025 |
| Americans concerned AI could threaten humanity | 77% | YouGov, Dec 2025 |
The top row is the one most pages quote and stop at. The Stanford figure that 78% of organizations reported using AI in 2024, up from 55% the year before is real and current. It is also only half a sentence. The bottom rows are the other half.
What the AI adoption rate actually is, and why three surveys disagree
The honest answer to "what is the AI adoption rate" is: it depends on what you count and who you weight. The spread is not noise. It is methodology.
The US Census Business Trends and Outlook Survey, summarized by the Federal Reserve, puts firm-level adoption at about 18 percent of firms at the end of 2025. That counts every business equally, including the corner store. Weight the same data by employment, so a 5,000-person company counts more than a sole proprietor, and the Fed's figure jumps to around 78 percent. Survey only larger enterprises about generative AI specifically, as Bain did, and you get 95% of companies in the US using it, up 12 points in just over a year.
NOTE
18%, 78%, and 95% are all correct. They answer different questions. "What share of all firms?" is 18%. "What share of the workforce is at a firm using AI?" is 78%. "What share of large companies touch generative AI?" is 95%. Quote the one that matches your claim, and say which it is.
For a SaaS product team, the employment-weighted view is usually the relevant one. Your buyers work at companies that have already adopted AI somewhere. The aggregate still hides the spread that matters to your roadmap, since AI adoption by industry moves the trust baseline a regulated buyer brings to your feature. The question is no longer whether they use AI. It is whether they will trust yours.
AI usage statistics: where the adoption is actually happening
Adoption headlines hide a sharper truth in the AI usage statistics: most real usage is concentrated, not universal. Two groups are far ahead of the average.
Developers lead. Per the Stack Overflow survey, 76% of developers are using or planning to use AI tools, up from 70%, and the share currently using them rose from 44% to 62% in a single year. Individual knowledge workers are next: the Federal Reserve's population survey puts work-related generative AI use at about 41 percent of the workforce as of late 2025. That ordering is not random, it is the AI adoption curve playing out, with the eager early users in front and the skeptical majority you actually need to retain still behind them.
The gap between "has access" and "actually relies on it" is where teams fool themselves. A useful way to separate the two:
Real adoption  =  users who complete the AI-assisted task
                  --------------------------------------------
                  users who were shown the AI feature

If the denominator is "logged in" and the numerator is "clicked once,"
you are measuring exposure, not adoption. Track the task, not the click.
Exposure is easy to manufacture. Adoption that moves a metric is not. We go deeper on this in the AI adoption metrics worth tracking.
How fast is AI adoption growing
Fast, but read the growth rates honestly. Year-over-year deltas are where the real AI adoption trends show up, and they are steep across every source.
| Measure | From | To | Source |
|---|---|---|---|
| Organizations using AI | 55% (2023) | 78% (2024) | Stanford HAI |
| US firms (firm-weighted) | grew ~68% YoY | ~18% end 2025 | Federal Reserve |
| Developers using AI tools | 70% | 76% | Stack Overflow |
| Generative AI production use cases | baseline | up 101% | Bain |
Bain found production use cases up 101% between October 2023 and December 2024, with the share of companies naming AI a top priority climbing from 9% to 15%.
WARNING
A high growth rate off a low base is not the same as saturation. Firm-level adoption growing 68% still leaves most small firms not using AI. Do not let a percentage-change headline talk you into a market that is not there yet for your segment.
Enterprise AI adoption data vs the trust gap
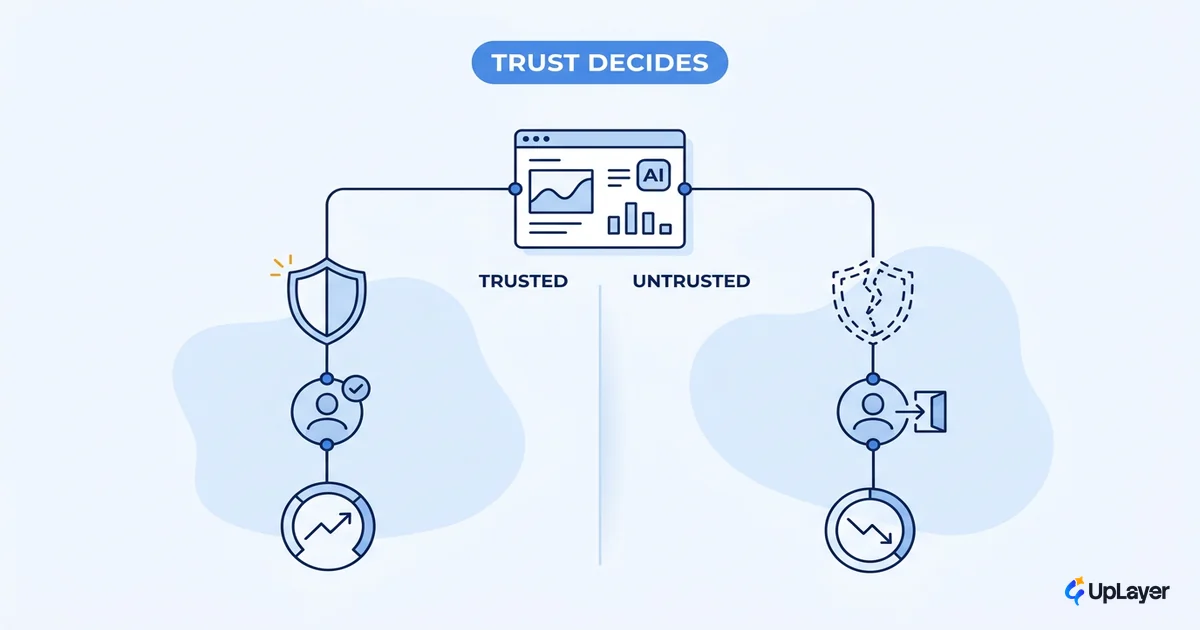
Here is the number the adoption headlines leave out, and it is the one that should set your roadmap. Pair the enterprise AI adoption data with the trust data and the picture inverts.
Usage is high. Trust is not. In the Stack Overflow survey, only about 43% of developers trust the accuracy of AI output, with 31% actively distrusting it, and favorable sentiment slipped from 77% to 72% as more people actually used the tools. Among the broader public, Pew found that 51% of US adults are more concerned than excited about AI, against just 15% of AI experts. And YouGov reports that 77% of Americans are concerned AI could pose a threat to humanity.
Exposure has gone up. Trust has not. For product teams, that means adoption alone is not enough. You have to earn the trust, not assume it ships with the feature.
This is the wedge. Most AI is theater because teams optimize for the adoption number, ship a feature that demos well, and never close the trust gap that decides whether anyone keeps using it. Reliability and human-in-the-loop design are not nice-to-haves here. They are the difference between a feature people use and a feature people fear. We cover the mechanics in building user trust in AI features and the thresholds in AI reliability benchmarks for SaaS features.
What percentage of SaaS products use AI
Close to all of them claim to, and that is exactly the problem. "Uses AI" has become table stakes, which means it no longer differentiates. The honest version of "what percentage of SaaS products use AI" is: nearly every product now ships some AI surface, and most of those surfaces move no metric.
We do not publish an invented percentage here, because the credible ones measure "has an AI feature," not "has an AI feature users trust and return to." Those are different populations, and the second is much smaller. As a Concept Demo of the reasoning: if 90% of products in a category ship an AI feature but only a fraction clear a usable trust and reliability bar, the projected advantage belongs to the team that earns the second number, not the first.
TIP
The useful question is not "does our product use AI." It is "does our AI feature move a metric we already track, and do users trust it enough to keep using it." If the answer is no, the right move is often to not build it. Saying no to the wrong AI feature is the highest-ROI decision on the list.
What AI adoption trends mean for the feature you ship next
What do AI adoption rates look like in 2026? High and rising on usage, flat and low on trust. Translate that into a product call rather than a press release. Each trend maps to one of three moves.
| The trend | What it means for you | The move |
|---|---|---|
| Adoption is near-universal | "Has AI" no longer differentiates | Build only where it moves a tracked metric |
| Trust is low and slipping | Users won't extend benefit of the doubt | Guard it: reliability, human-in-the-loop, clear sourcing |
| Developers adopt fastest | Internal/dev-facing AI lands first | Pilot there, where tolerance for rough edges is higher |
| Most features move no metric | The default outcome is a flop | Skip the ones with no projected ROI |
Build, guard, or skip. That is the entire decision, and the data above is the input. The teams that win the next two years are not the ones that ship the most AI. They are the ones that ship the least AI that pays off, and guard it hard enough that the trust number stops being a liability.
Read these AI adoption statistics as a map, not a scoreboard. The adoption race is over, and almost everyone is in it. The next race is trust, and it is wide open. Pick the one feature that moves a metric you already track, prove it before you build it, and put your reliability work where users won't forgive a mistake.
TIP
Want to know which AI feature in your product is worth building, and which to kill? How the AX Audit works.