AI adoption by industry and what it means for you
AI adoption by industry varies wildly by sector. See the real rates, what a high or low number means for your roadmap, and the feature worth building.
 Shahriar P. ShuvoAI Adoption & Trust7 min read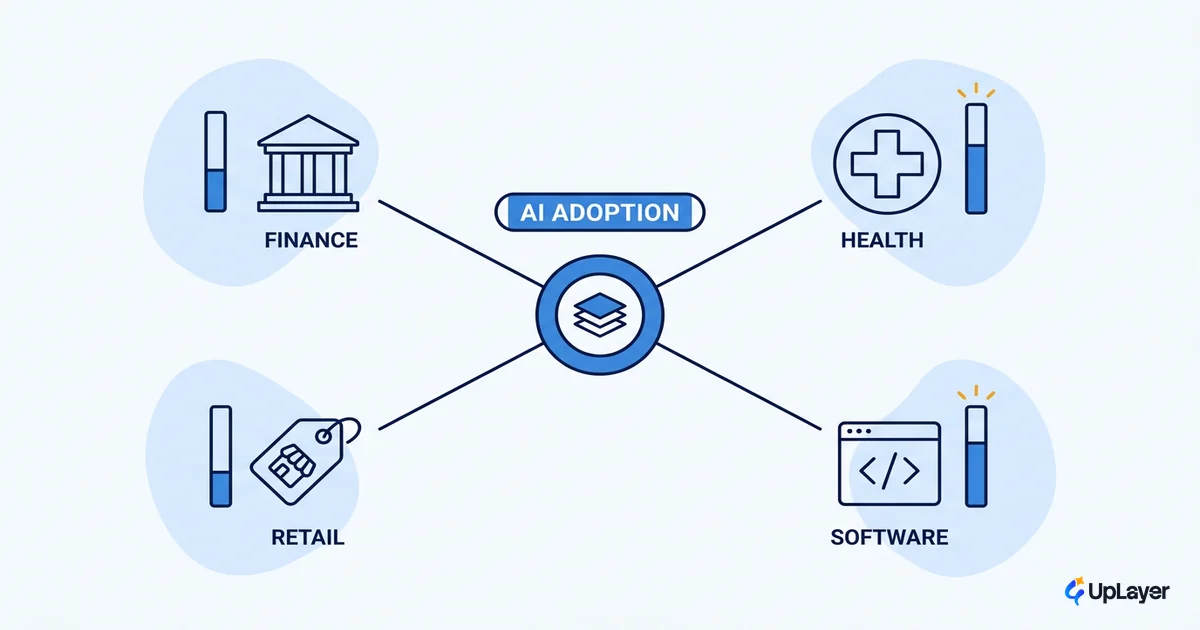
The adoption rate for your industry tells you almost nothing about whether you should ship an AI feature. It tells you a lot about whether a demo will be enough to win. That distinction is the whole game, and most charts about AI adoption by industry hide it behind a single percentage.
Here is the version that helps you make a decision. We will look at the real per-sector numbers, separate the sectors where AI is already table stakes from the ones where it is still an open lane, and translate your sector's rate into a choice about the next feature you build. The goal is not to admire the data. It is to place your own product on the map.
AI adoption by industry: the numbers that actually hold up
Start with the floor. Across all U.S. businesses, the AI use rate sits near 20%, but the spread between sectors is enormous, and that spread is the only part of the data that should change your plans.
The most credible figures come from federal surveys, not vendor roundups. As of the data collection period ending in May 2026, the Information sector and Finance and Insurance run well above the national average, at 39.7% and 33.9% against a national rate of 19.8%. Retail Trade sits below the line at roughly 14%. Firm size pulls just as hard as sector: 37% of firms with at least 250 employees report using AI, while fewer than 20% of the smallest firms do.
The national business AI use rate was 19.8% as of May 2026, with Information at 39.7% and Finance and Insurance at 33.9%. (U.S. Census Bureau, Business Trends and Outlook Survey)
If you want to go deeper on the headline figures, the broader AI adoption statistics post keeps a sourced set. And if your real question is what to do once you know your sector's number, that belongs to increasing AI adoption inside your own product, the cornerstone this post sits under. For now, the number itself is a starting point, not a verdict.
AI adoption rates by sector, from table stakes to open lane
Put the sectors side by side and a pattern appears. The service industries that sell information, advice, and money are ahead. The industries that move physical goods or serve customers in person are behind. The Federal Reserve's tracking of AI adoption rates by sector puts professional, scientific, and technical services and financial services at the front, and accommodation and food services near the back.
| Sector | Approx. AI use rate | What that means for you |
|---|---|---|
| Information | ~40% | Table stakes. A basic AI feature reads as catching up, not leading. |
| Finance & Insurance | ~30-34% | High bar. Reliability and trust matter more than novelty here. |
| Professional, scientific & technical | ~33% | Crowded. Differentiate on a metric, not a demo. |
| Wholesale Trade | ~13% | Open lane. A useful feature can stand out. |
| Retail Trade | ~14% | Open lane. Adoption is early; proof beats hype. |
| Accommodation & Food | ~8% | Wide open, but check that AI fits the real job. |
The leaders are not ahead because AI is easy in their sector. They are ahead because their work is already made of text, numbers, and decisions that a model can touch. That is also why their bar is higher: when a third of your competitors already ship AI, your version has to do something theirs does not.
Which industries are adopting AI fastest, and why it cuts both ways
The fastest movers are the information, professional services, and financial sectors. Being in one of them is usually treated as good news. It is closer to a warning.
When 78% of organizations now report using AI, as Stanford's 2025 AI Index found, "we have AI" stops being a differentiator and becomes the price of entry. The gap that matters is no longer adopted versus not adopted. It is AI that shipped versus AI that moved a metric. Plenty of features in high-adoption sectors demo well, launch, and change nothing a customer would pay more for.
78% of organizations reported using AI in 2024, up from 55% the year before. Widespread use means adoption alone no longer sets you apart. (Stanford HAI, 2025 AI Index Report)
So the speed of industry AI adoption in your sector cuts both ways. A fast sector means buyers expect AI and forgive nothing that feels like theater. A slow sector means you have room, but also that you carry the burden of proving the feature is worth trusting at all.
How does AI adoption differ by industry for your roadmap
Here is the part the charts skip. The way AI adoption differs by industry should change your roadmap through two variables, not one: your sector's rate, and whether your planned feature ships a demo or moves a number you already track.
Place your product with this rule.
PLACEMENT RULE

sector_rate     = high (>30%) or low (<20%)
feature_payoff  = "moves a tracked metric" or "just ships"

high sector + moves a metric   -> build it, lead on the metric
high sector + just ships       -> do not build; you will blend in
low  sector + moves a metric   -> build it now; clean open lane
low  sector + just ships       -> wait; a demo wins nothing here

Decision = sector_rate tells you the bar.
           feature_payoff tells you if you clear it.
The 2x2 is blunt on purpose. Three of the four cells tell you to either lead with a metric or not build. Only one cell, a metric-moving feature in an open sector, is an easy yes. This is the same logic behind reading where your users sit on the adoption curve: the sector rate sets the room temperature, but the individual user decides whether your feature earns a second use.
WARNING
A high adoption rate in your sector is not a reason to ship AI. It is a signal that a demo will not be enough. Define the metric the feature has to move before you pick a model.
What the AI adoption rate in your sector means for the feature you build next
So what is the AI adoption rate in your sector actually telling you to do? Not "ship AI because everyone else is," and not "wait because no one has." It is telling you how high the bar sits, so you can decide whether the feature you have in mind clears it.
In a high-adoption vertical, vertical AI adoption has already commoditized the obvious features. Your move is a supportive layer tied to a metric your team watches, like activation, retention, or support deflection, built reliably enough to trust. In a low-adoption vertical, the same rule holds with less competition: pick the one feature that moves a number, prove it, then expand. Either way, the answer is the same shape, which is why we map it through adoption strategies that actually move a metric rather than chasing parity with your sector's average.
NOTE
These rates measure whether firms use AI at all, not whether that AI works. A sector at 40% adoption can still be full of features that never moved a metric. Treat the number as a bar to clear, not a result to copy.
The honest read of AI adoption by industry is that the percentage is a starting line, not a strategy. Knowing your sector sits at 14% or 40% only tells you how loud the room is. The feature still has to earn its place against a number you already track, and that work is the same in every vertical. Start from the metric, build the supportive layer, and let the adoption rate tell you how hard you have to prove it.
TIP
Want to know which single AI feature is worth building in your sector, scored against a metric you already track? How the AX Audit works.