AI reliability benchmarks for SaaS features
AI reliability benchmarks by feature type: real production ranges, what teams actually hit, and the accuracy threshold worth holding the line on for each.
 Shahriar P. ShuvoAI Adoption & Trust8 min read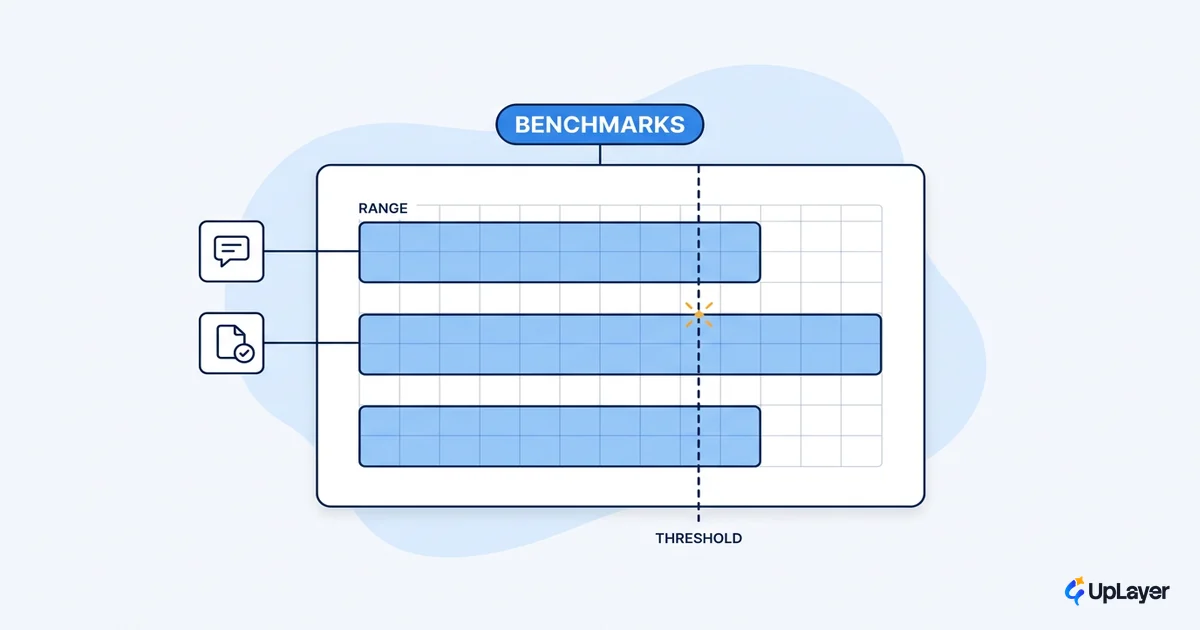
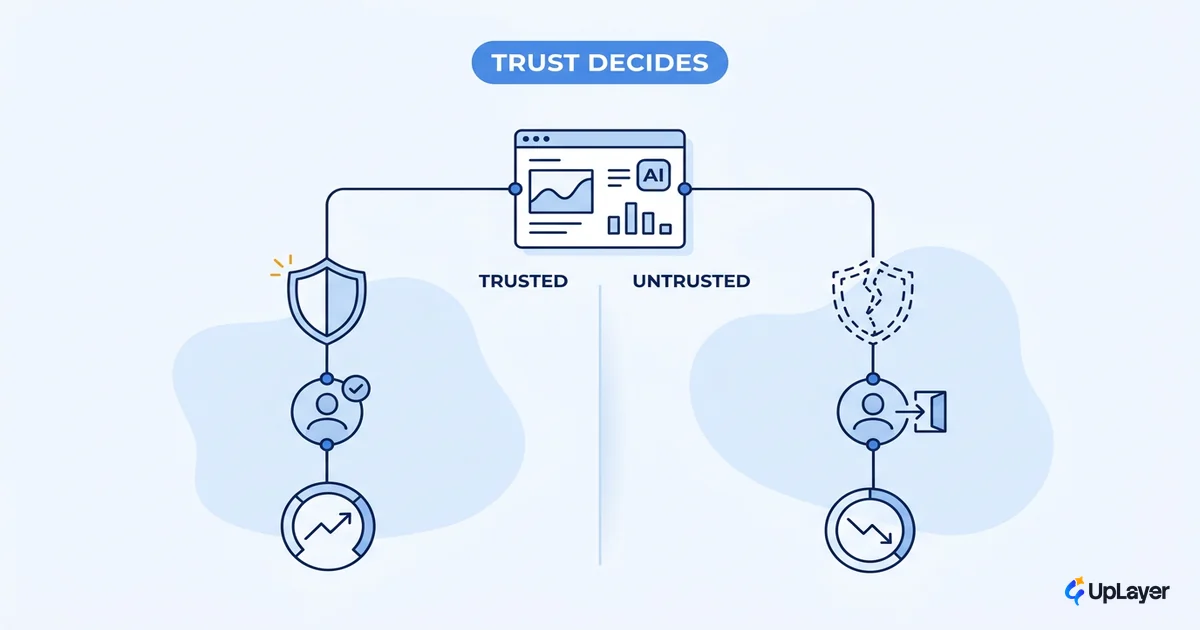
Most teams set a reliability target by copying a model vendor's headline number into a planning slide. The model card says 95% accuracy, so the feature gets a 95% target, and everyone moves on. Then the feature ships, demos clean, and quietly erodes trust in production. The benchmark was never wrong. It was just answering a different question than the one you needed answered.
AI reliability benchmarks describe how a model behaves in a lab, on a fixed test, under ideal conditions. They do not tell you whether your support-reply feature is safe to ship. This post closes that gap. Below are the real ranges production AI features hit, broken out by feature type, plus the accuracy threshold worth holding the line on for each. The numbers come from public leaderboards, not from us, so you can cite them and defend them. Reliability, like ROI, is a number you gate on, not a story you tell. Knowing how to increase AI adoption starts with picking that number on purpose.
What AI reliability benchmarks actually measure
An AI reliability benchmark measures how often a model produces a correct, faithful output on a standardized test set. It is a lab condition. Your feature is a production system. Those are not the same thing, and conflating them is where most reliability targets go wrong.
Three numbers do most of the work when people say "reliability":
- Accuracy. The share of outputs that match the expected answer on a benchmark.
- Factual consistency / hallucination rate. How often the output invents facts not supported by the source. Hallucination rate is just 100% minus factual consistency.
- Answer rate. How often the model responds at all instead of refusing.
The catch is that public accuracy scores are measured under controlled conditions. Standard benchmarks like MMLU and GPQA are run zero-shot with a fixed prompt, as OpenAI's simple-evals project documents, which makes them a lab condition, not a product guarantee. Your users do not send clean benchmark prompts. They send typos, edge cases, and questions the test set never imagined.
A sharper lens is hallucination on a constrained task. When you ask leading models to summarize a short document using only the facts in it, the Vectara hallucination leaderboard shows the best model still hallucinates on roughly 1 in 50 documents, and a 9.6% median across 105 models. That is the floor on a task with the answer sitting right there in the source. Open-ended generation is worse.
NOTE
A model benchmark answers "how good is this model on a test." A feature reliability target answers "how often can this feature be wrong in front of a paying user before it costs us more than it earns." Only the second one ships a product.
What production AI features actually hit (the data)
Benchmark scores are climbing fast, and that is the trap. According to Stanford HAI's 2025 AI Index, benchmark scores rose 18.8, 48.9, and 67.3 percentage points on MMMU, GPQA, and SWE-bench respectively in a single year. Rising lab scores make it tempting to assume production reliability rose by the same amount. It did not.
Here is what the public leaderboards actually report, by the kind of task that maps to a real SaaS feature. These are model-level benchmark numbers, the ceiling your feature inherits before production conditions pull it down.
| Benchmark task | What it maps to | Source | Reported range |
|---|---|---|---|
| Document summarization (HHEM) | Summaries, digests, recaps | Vectara | 1.8% best, 9.6% median, 24.2% worst hallucination rate across 105 models |
| Zero-shot accuracy (MMLU/GPQA) | Classification, Q&A | OpenAI simple-evals | Single fixed-prompt accuracy score, no production noise |
| Issue resolution (SWE-bench Verified) | Agentic / autonomous action | SWE-bench | Share of real GitHub issues an agent actually resolves, on a human-filtered 500-issue set |
Two things stand out. First, the spread is enormous: on the same summarization task, the share of models that hallucinate on more than 1 in 10 documents is 47%. Picking the model matters as much as picking the threshold. Second, the honest measure for autonomous work is the share of real GitHub issues an agent actually resolves on the human-filtered SWE-bench Verified set, not a synthetic pass rate. When the task is "did it actually fix the thing," numbers come down to earth.
AI accuracy benchmarks: reliability ranges by feature type
Reliability is not one number. It is a band, and the band depends on the feature and on whether a human stands between the output and the user. Below is the original mapping we use when scoping AI features. "Hold the line at" is the threshold below which the feature should not ship in that mode.
| Feature type | Typical production range | What good looks like | Hold the line at | Default mode |
|---|---|---|---|---|
| Summarize / draft (human approves) | 88-96% factual consistency | reviewer edits, never rewrites | ≥90% | supervised |
| Classify / route (tags, priority) | 90-97% accuracy | clean fallback to a human queue | ≥92% | supervised |
| RAG answer (grounded Q&A) | 80-94% faithful | every claim traceable to a source | ≥90% + citation | supervised |
| Suggest / autocomplete (inline) | 70-90% useful | easy to ignore, cheap to dismiss | ≥75% | assistive |
| Autonomous action (no human) | wildly variable | reversible, logged, rate-limited | ≥98% + rollback | rarely ship |
These are AI accuracy benchmarks expressed as feature gates, not vanity scores. A 92% draft-a-reply feature with a human approving is shippable. A 92% feature that posts the reply unsupervised is not, because the 8% lands in front of a customer with no one to catch it. Same model, same accuracy, opposite decision. That is the whole point.
What accuracy should a SaaS AI feature hit?
There is no single number. The right threshold comes from the cost of being wrong, not from the model's headline benchmark. A reliability target you can defend is built from three inputs:
reliability_target = f(blast_radius, reversibility, human_in_path)

blast_radius   = how many users / how much money one wrong output touches
reversibility  = can the action be undone cheaply (edit a draft) or not (charge a card)
human_in_path  = does a person approve before the output reaches the user

Rule of thumb:
  reversible + human approves     -> ship at 88-92%   (draft, summarize, suggest)
  reversible + no human           -> ship at 95%+     (auto-tag, route)
  irreversible (any path)         -> ship at 98%+ with rollback, or do not ship
Set the target from the bottom row up. If the action is irreversible, no realistic benchmark earns you the right to remove the human. If it is reversible and a person approves, you can ship at a number that would be reckless anywhere else, because the human is the reliability layer.
WARNING
The most common production failure is running an unsupervised feature at a supervised threshold. A 93% accuracy that is fine for a draft a human approves becomes a 7% rate of wrong actions taken automatically, at scale, with no one watching. Define the mode before the model.
So what is a good reliability benchmark for an AI feature? It is the lowest accuracy at which the cost of the errors you will ship is smaller than the value of the feature. For a supportive layer with a human approving, that is often 88 to 92%. For anything touching money or data irreversibly, treat 98% as the floor and add a rollback path on top.
How reliable are AI features in production, really?
Less reliable than the benchmark, always. Lab scores are measured on clean, in-distribution test sets. Production traffic brings drift, adversarial input, and long-tail prompts the benchmark never contained. The gap between a model's published number and its lived reliability is the gap that surprises teams after launch.
Grounding helps but does not close it. Even retrieval-augmented answers carry a measurable factual-reliability gap, as the RAGTruth factual-reliability work shows: grounding lowers the error rate but does not zero it. A RAG feature is more reliable than an ungrounded one, not perfectly reliable. You still need a target, and you still need a fallback.
The cheapest way to recover the lost reliability is to keep a human in the loop. A reviewer turns a 92% model into a 99%-plus feature, because the human catches the 8% before it ships. This is the core of what AI reliability means in practice: reliability is a property of the system, the model plus the guardrails plus the human, not of the model alone.
What not to ship at any benchmark
Some features should not run unsupervised no matter how high the score climbs. The benchmark is a distraction here. The question is blast radius and reversibility, and for these the answer never clears the bar:
- Irreversible financial actions (refunds, charges, payouts) decided by a model alone.
- Anything legal, medical, or compliance-facing presented as fact without a citation and a human signoff.
- Deleting or overwriting customer data on a model's judgment.
- Customer-facing claims a model generates freely, where one hallucination becomes a public promise you have to honor.
For these, reliability guardrails and a human approval step are not optional polish. They are the feature. A model that is right 99% of the time still ships a wrong irreversible action 1 time in 100, and at scale that is a steady stream of incidents. Reliability theater is shipping the impressive demo and discovering the 1% in your incident channel.
The teams that win with AI are not the ones chasing the highest model score. They are the ones who read AI reliability benchmarks as a starting ceiling, set a threshold from the cost of being wrong, and put a human where the cost is high. Pick the number on purpose, gate on it, and let the guardrails do the rest.
TIP
Want the highest-ROI AI feature for your SaaS, scoped to a reliability threshold you can actually defend? How the AX Audit works.