AI ROI metrics: churn, activation, conversion, expansion
AI ROI metrics differ by the number you target. A map from churn, activation, conversion, and expansion to the AI layer that moves each one.
 Shahriar P. ShuvoAI ROI & Strategy7 min read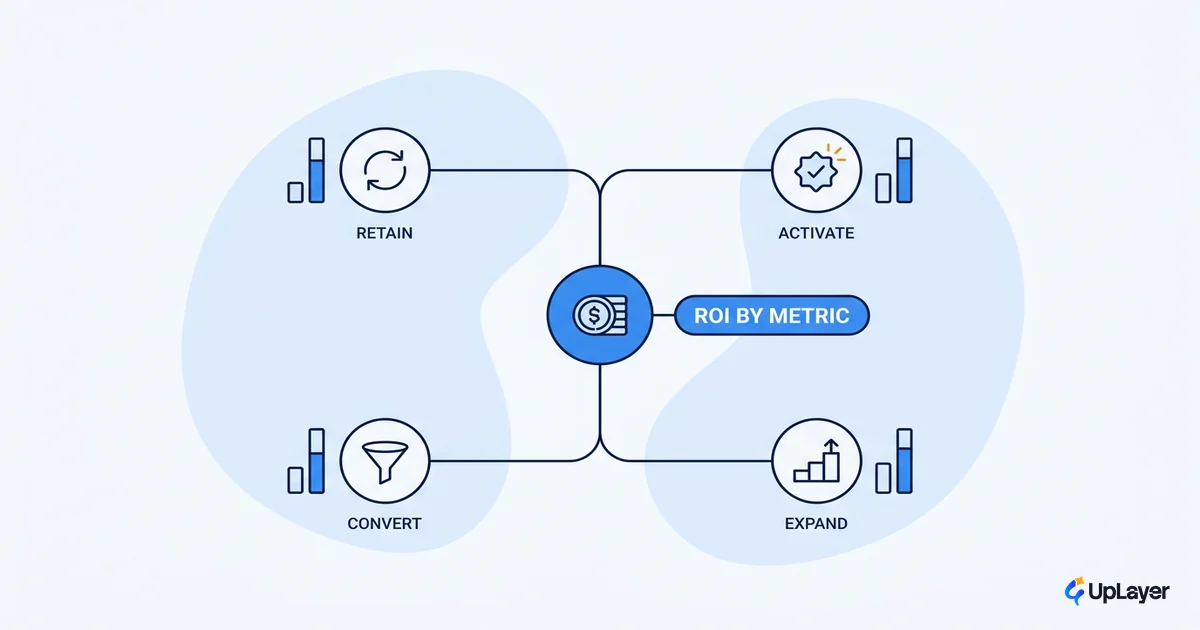
Most AI features ship and move nothing. The pattern is well documented: a recent MIT study found that roughly 95% of enterprise GenAI pilots produced no measurable impact on P&L, and the cause was integration and a learning gap, not model quality. The teams that whiff almost always make the same mistake. They pick the feature first and never pick the metric.
That is the real lesson buried in the AI roi metrics conversation. A churn play and an activation play are not the same investment with a different label. They have different baselines, different value math, and different odds of paying off. The metric you target reshapes everything downstream.
So before you scope a single AI feature, answer one question: which number on your board are you trying to move? This is a map. For each metric a post-product-market-fit SaaS already tracks, here is the AI layer that moves it, the rough math, and what to skip. If you want the full method behind the math, start with how to measure the ROI of an AI feature.
Why most AI ROI metrics measure the wrong thing
A single blended "AI ROI" number is a comfort blanket. It hides the only decision that matters: which metric the feature was built to move.
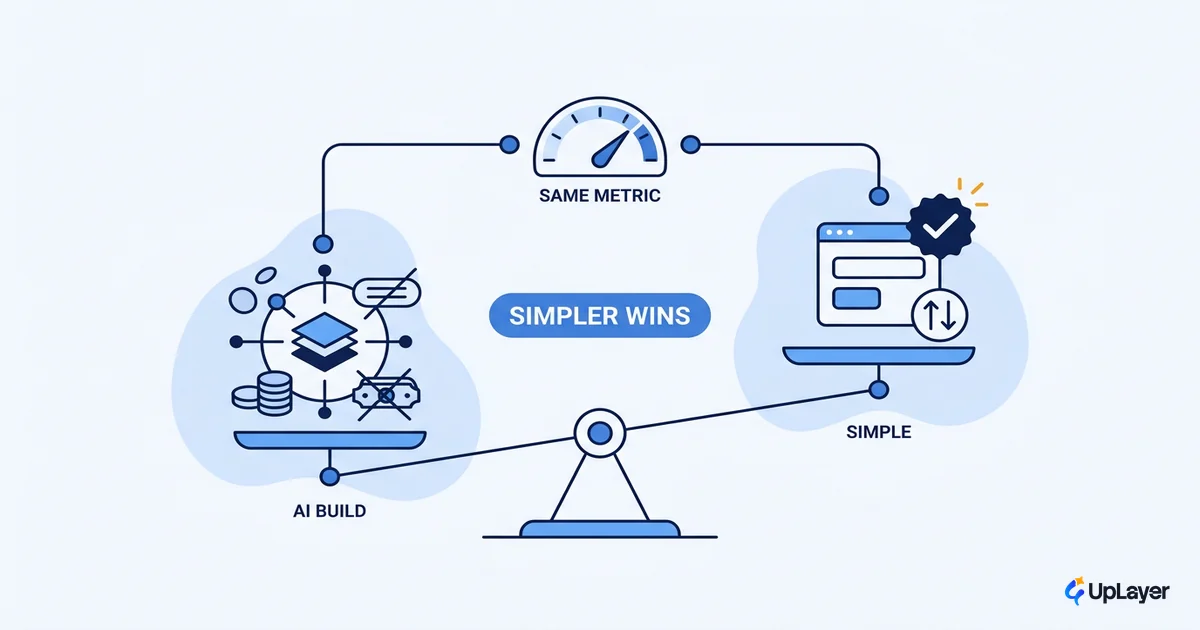
Most AI roi metrics you see reported are internal-productivity savings. Hours saved times an hourly rate. They are easy to claim because the math is tidy and nobody audits the counterfactual. They are also the weakest case for a product feature, because they do not touch the revenue numbers your board actually grades you on. Saving your support team nine hours a week is real. It is not the same as keeping a customer who was about to leave.
The metrics worth building toward are the ones already on your dashboard: retention activation conversion and expansion. They are harder to move. They are also worth far more, and they are defensible, because you can tie the lift to revenue instead of to a productivity guess.
NOTE
An AI feature that saves internal time is an efficiency play. An AI feature that moves churn, activation, conversion, or expansion is a revenue play. Score them on different scales. Do not let a productivity number stand in for a growth number.
Which metric should an AI feature target?
The honest answer is: the one with the most revenue headroom that your AI layer can credibly move. Different metrics demand different features. Here is the map.
| Metric | The AI layer that moves it | What drives projected ROI | Realistic ceiling | What not to build |
|---|---|---|---|---|
| Churn / retention | Risk scoring, in-product save flows, support resolution (not deflection) | Retained MRR; a small % lift compounds | High value, slow to attribute | A churn dashboard nobody acts on |
| Activation | Guided onboarding, contextual assistants, smart defaults to first value | More trials reach the "aha" and convert | Wide headroom, fast to prove | A chatbot that adds a step instead of removing one |
| Conversion | Trial-to-paid nudges, lead scoring, in-product upgrade prompts | Higher trial-to-paid rate on existing traffic | Moderate, clean to measure | A generic recommender with no upgrade path |
| Expansion | Usage-based upsell triggers, seat-expansion signals, value surfacing pre-renewal | Net revenue retention above 100% | Compounds quietly, slow signal | "AI insights" tabs nobody opens |
Pick a row before you pick a feature. The rest of this post walks each one.
AI ROI on churn: the highest-leverage, hardest-to-attribute bet
Start here if retention is your weak point, because the leverage is enormous. Per research from Bain popularized by Harvard Business Review, a 5% lift in retention can raise profits by 25% to 95%, and acquiring a new customer runs five to 25 times the cost of keeping one. The underlying economics of retention are why a one-point churn improvement can outrun a whole quarter of new sales.
Increasing customer retention rates by 5% increases profits by 25% to 95%. (Frederick Reichheld, Bain & Company)
The AI layer that moves churn is not a model that predicts who will leave. It is the action wired to that prediction: an in-product save flow, a support assistant that resolves the actual issue, a nudge that lands before the user gives up. Prediction without action is theater.
The math is simple. The hard part is honesty about it.
Projected churn ROI (annual)
= retained_logos x avg_account_value
  - build_cost - run_cost

retained_logos = at_risk_accounts
               x model_precision
               x save_flow_success_rate
The trap is attribution. Some of the accounts your save flow "rescued" would have stayed anyway, and the lag between intervention and renewal makes it easy to fool yourself. Discount your projected roi for the would-have-stayed-anyway effect, or you will overstate the win. Do not build a churn-risk dashboard with no save flow attached. That is the single most common AI feature that moves nothing.
AI ROI on activation: the fastest feedback loop
If you are weighing whether AI should improve churn or activation, activation usually wins on speed. You learn whether it worked in days, not quarters.
The headroom is real. Across B2B SaaS, the median activation rate sits around 37%, with product-led companies averaging 34.6% and sales-led ones 41.6%. Most of your signups never reach first value. That gap is the opportunity.
The AI layer here removes steps. Guided onboarding that adapts to the user's goal, a contextual assistant that answers in-product instead of sending them to docs, smart defaults that skip configuration. The goal is fewer clicks to the aha moment, not a chatbot bolted onto the corner.
Activation is the easiest metric to instrument because the loop is short and the cohort is clean. You can run a holdout, watch activation by cohort, and read the result before the next board meeting. That makes it the best place to learn how to measure ai roi on a real feature before you bet on a slower metric.
TIP
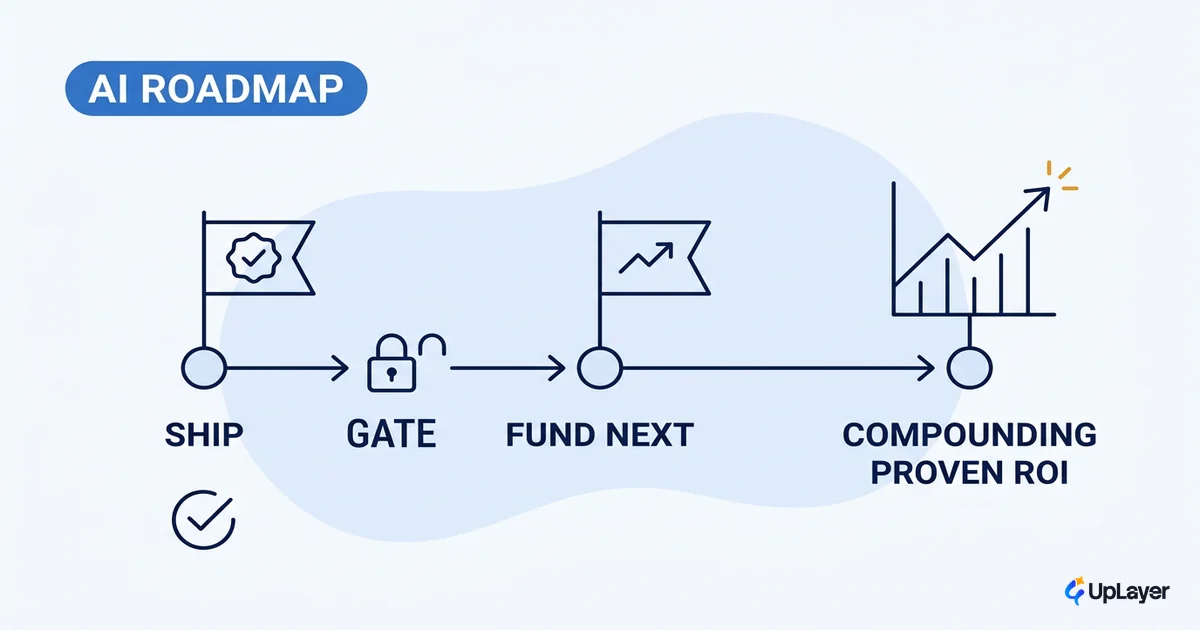
If this is your first AI feature, target activation. The feedback is fast, the baseline is well understood, and a clean win there builds the internal credibility you will need to fund the slower churn and expansion bets.
AI ROI on conversion and expansion: revenue you can point a model at
Conversion and expansion are where AI touches revenue most directly, and where the proof is strongest.
For conversion, the AI layer is the nudge: trial-to-paid prompts timed to usage, lead scoring that routes attention, in-product upgrade paths that appear when the user hits a value ceiling. For expansion, it is the supportive layer that surfaces unused value before renewal and flags seat or usage growth as an upsell signal. Both lean on the same idea: meet the user with the next step at the moment they are ready for it. That is the spine of an AI value framework worth running.
The proof that AI moves revenue metrics, not just productivity, is on the record. In Forrester's Total Economic Impact study of Microsoft 365 Copilot, the composite organization moved its sales win rate by 2.5% and customer retention by a point, lifting top-line revenue by 2.6% and landing a 116% ROI over three years. The percentages look small. On a real revenue base, a point of retention plus two-and-a-half points of win rate is a large number.
Expansion math runs through net revenue retention, the metric investors weigh most:
Expansion lift (annual)
= base_mrr x (target_NRR - current_NRR)
  - build_cost - run_cost

# 105% NRR vs 100% on $5M base MRR
# = $5,000,000 x 0.05 = $250,000/yr before cost
Conversion and expansion share a quality: the signal is cleaner than churn because the action and the outcome sit close together in time. You nudge, they upgrade, you measure. That is revenue you can point a model at.
How to pick the right metric for AI ROI
The sequence matters more than the model. Here is how to pick the right metric for ai roi without guessing.
1. Start from the metric your board grades you on.
2. Check baseline and headroom. No headroom, no project.
3. Estimate the AI lift, conservatively. Discount it again.
4. Multiply lift by the revenue value of the metric.
5. Divide by build + run cost. That is your projected ROI.
6. Rank every candidate by this number. Build the top one.
Run that for each metric and a winner usually falls out. A high-headroom activation play with a fast loop often beats a high-value churn play you cannot attribute for two quarters. Sometimes the reverse. The point is that you compared them on the same scale instead of building the feature someone demoed.
WARNING
Beware the productivity-savings trap. Hours-saved math is the easiest ROI number to produce and the easiest to inflate, because the counterfactual is invisible. If a feature only justifies itself on internal time saved, it is probably not the feature that moves your business. Hold it to a revenue metric or kill it.
Two more siblings round out the method: the field guide to the AI ROI metrics that actually matter, and the prioritization logic to decide which AI features to build once you have your projected numbers. We frame every projection as a Concept Demo, designed to move a named metric, never an invented client result.
The choice of which ai roi metrics to chase is a strategy decision, not a reporting one. Pick the metric your board cares about, confirm it has headroom, then scope the AI layer that moves it. Do that and your next feature has a job before it has a spec.
TIP
We map your AI opportunities to the metric you already track and project the return before you build. How the AX Audit works.