An AI value framework for product teams
An AI value framework scores any AI feature on metric impact, confidence, cost, and reach, so product teams build what pays off and kill what does not.
 Anamoul RoufAI ROI & Strategy7 min read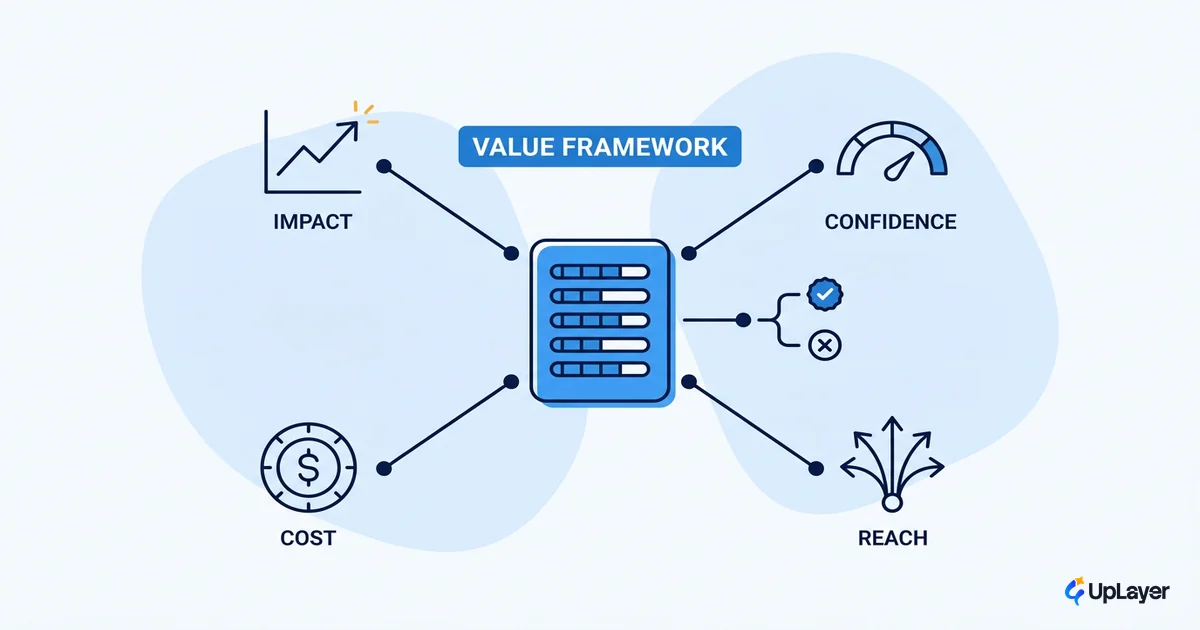
Most AI feature decisions are made on pressure, not evidence. A board asks what you are doing about AI, a competitor ships a chatbot, and a feature gets greenlit because it demos well in a Friday review. An AI value framework replaces that vibe with a number. It scores a proposed feature on what it will do to a metric you already track, how sure you are, what it costs, and how many users it touches, then gives you one figure you can compare against every other idea in the backlog.
The useful part is not the features it tells you to build. It is the ones it tells you to drop. A framework that only ever says yes is a permission slip, not a decision tool. Used honestly, this one produces a kill list as readily as a roadmap, which is the whole point of deciding which AI features to build before you write code.
This piece gives you a four-input scoring sheet you can run on a single feature in an afternoon, the formula behind it, a worked example, and the rule for when the score says stop.
What is an AI value framework
An AI value framework is a scoring method that converts a proposed AI feature into one comparable number from four inputs: metric impact, confidence, cost, and reach. It is not a one-line ROI formula. ROI assumes you already know the gain, when the actual problem is that nobody does. The framework forces you to name the metric the feature is supposed to move, estimate the move, and discount it by how much you trust the estimate.
That discipline is not new. The NIST framework for managing AI defines four functions, govern, map, measure, and manage, and the measure function exists because AI value has to be quantified through a measurable process, not asserted in a slide. A value framework is the product-team version of that idea: every claim about value ties back to a number you can check.
The metric has to be one you already track. Churn, activation rate, trial-to-paid conversion, support ticket volume, expansion revenue. If a feature cannot be connected to a metric on your existing dashboard, that is not a scoring problem, it is a sign the value is imaginary.
The four inputs that turn AI value into a number
A framework to evaluate AI feature value needs to stay small enough to run on a Tuesday. Score each input on a simple scale, then combine them. Keep the scales blunt on purpose. False precision is how teams talk themselves into bad features.
| Input | What it measures | Anchor it to | Scale |
|---|---|---|---|
| Metric impact | How much the target metric moves if this works | A metric already on your dashboard | 1 (barely) to 5 (material) |
| Confidence | How sure you are the move is real | Evidence, prior data, prototype results | 0.1 to 1.0 |
| Cost | Build plus run plus reliability work | Engineering weeks and ongoing model spend | 1 (cheap) to 5 (heavy) |
| Reach | Share of active users the feature touches | Your usage analytics | 1 (a sliver) to 5 (most) |
Metric impact and reach are your upside. Confidence is the honesty tax. Cost is the brake. The score that comes out is a projected ROI signal, not a guarantee, and you treat it that way.
value_score = (metric_impact * reach * confidence) / cost

# metric_impact: 1-5   how far the tracked metric moves
# reach:         1-5   share of active users affected
# confidence:    0.1-1 how much you trust the impact estimate
# cost:          1-5   build + run + reliability effort

# Build the high scorers. Defer the middle. Kill the bottom.
Confidence is the input most teams skip, and it is the one that does the most work. A feature that might move a metric a lot, but rests on a hunch, gets multiplied down to its real expected value. That is how you stop a confident-sounding idea from jumping the queue ahead of a boring one that will actually move a metric.
How do I score AI value on one feature
Run the sheet in five steps. The goal is a number you can defend, not a perfect one.
- Name the one metric the feature is meant to move. One, not three.
- Estimate the move and score metric impact 1 to 5 against your baseline.
- Estimate reach from real usage data, not the addressable market.
- Set confidence from evidence: a working prototype earns more than a vendor demo.
- Score cost across build, run, and the reliability work AI always needs, then compute.
Here is a Concept Demo, projected and not a real client. Say you are weighing an in-product support copilot meant to deflect tickets. The tracked metric is weekly support tickets per 100 active accounts. You project a meaningful drop, so metric impact is 4. It would touch most active accounts, so reach is 4. You have no prototype yet, only a vendor demo, so confidence is 0.4. It needs retrieval, guardrails, and human-in-the-loop review on escalations, so cost is 4. The score is (4 × 4 × 0.4) / 4, which is 1.6. Respectable, but the low confidence is dragging it. Building a thin prototype to lift confidence from 0.4 to 0.8 would double the score, which tells you exactly where to spend the next two weeks.
NOTE
The framework projects value before you build. After you ship, you still have to measure the ROI of an AI feature after you ship against the same baseline. The projection and the result rarely match on the first pass, and that gap is the most useful thing you will learn.
Comparing AI features with the framework
The score is only worth the math if you use it to rank a backlog, not to bless one idea in isolation. This is where a value framework becomes real AI feature prioritization: put every candidate through the same four inputs and sort. Buyers already think this way: enterprises selecting AI tools rank measurable value far above price, and implementation cost was cited in a large share of failed pilots, which is exactly the cost input the framework forces you to price in early.
A ranked sheet for three projected ideas might look like this.
| Feature (projected) | Impact | Reach | Confidence | Cost | Score | Call |
|---|---|---|---|---|---|---|
| Support copilot (with prototype) | 4 | 4 | 0.8 | 4 | 3.2 | Build |
| Smart onboarding nudges | 3 | 5 | 0.6 | 2 | 4.5 | Build first |
| AI report generator | 2 | 2 | 0.5 | 3 | 0.7 | Defer or kill |
The onboarding nudges win not because they are the most exciting feature but because cheap, wide reach with decent confidence beats an expensive, narrow bet. That is what an AI product strategy framework is for: it makes the unglamorous winner visible. When you are ready to sequence the survivors, the deeper method for how to prioritize AI features by projected ROI takes it from there.
What the framework tells you not to build
The lowest scorers are the real output. A feature that scores near the bottom is not a backlog item, it is a polite way to spend a quarter and move nothing on your ai roi metrics.
WARNING
A high-confidence, low-impact feature is the most dangerous kind. It is easy to build, it ships, everyone feels productive, and the metric does not move. Confidence in a small number is still a small number.
This is where the framework earns its keep, because saying no is the part the market avoids. Even on the leading edge, organizations struggle to scale value from AI, and a major reason work stalls is that value was never scored before money was spent. The fix is upstream. When a feature evaluated against defined metrics lands at the bottom of the sheet, you defer it or kill it, and you write down why. Keeping that kill list is how you stay honest the next time someone is sure their idea is different. For the patterns that show up there most often, the list of the AI features you should not build is a useful gut check.
Putting the AI value framework to work
Score before you sequence the roadmap, re-score after you ship against the same baseline, and keep the kill list where the next person who wants to do AI can see it. An AI value framework does not make AI decisions for you, but it makes the trade-offs legible, so the feature that survives is the one that will actually move a metric rather than the one that demoed best on a Friday.
TIP
Want the four-input score run on your real backlog, against the metrics you already track? How the AX Audit works.