How to measure the ROI of an AI feature
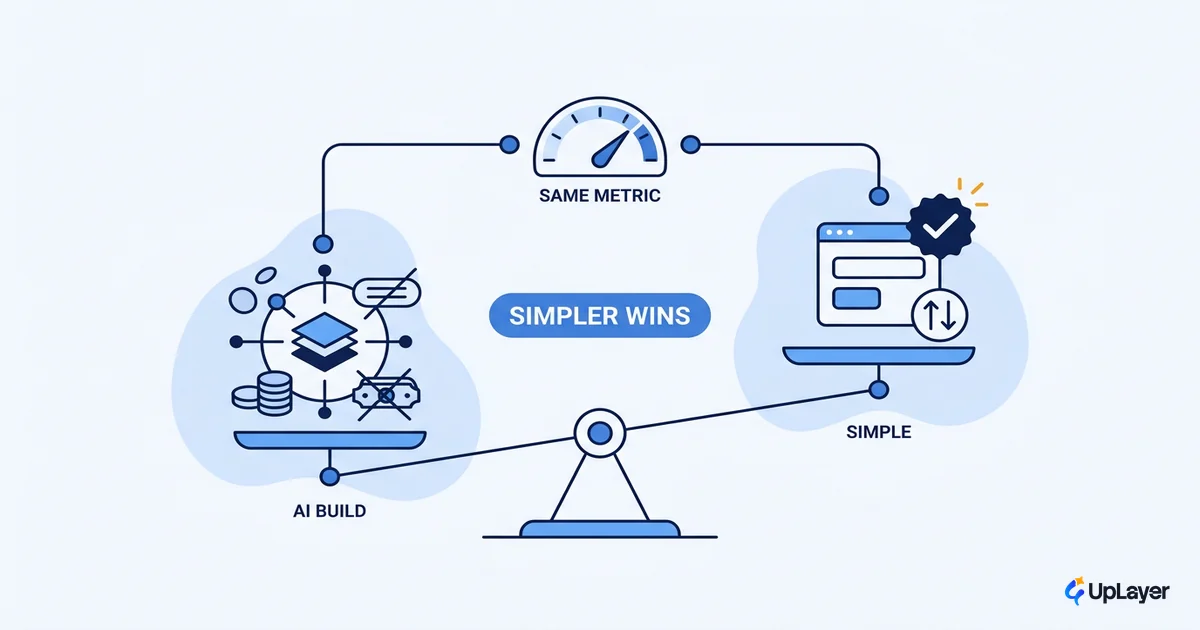
A practical method for AI ROI: tie one AI feature to one metric you already track, set a baseline, and measure the delta. ROI is a number, not a story.
 Shahriar P. ShuvoAI ROI & Strategy10 min read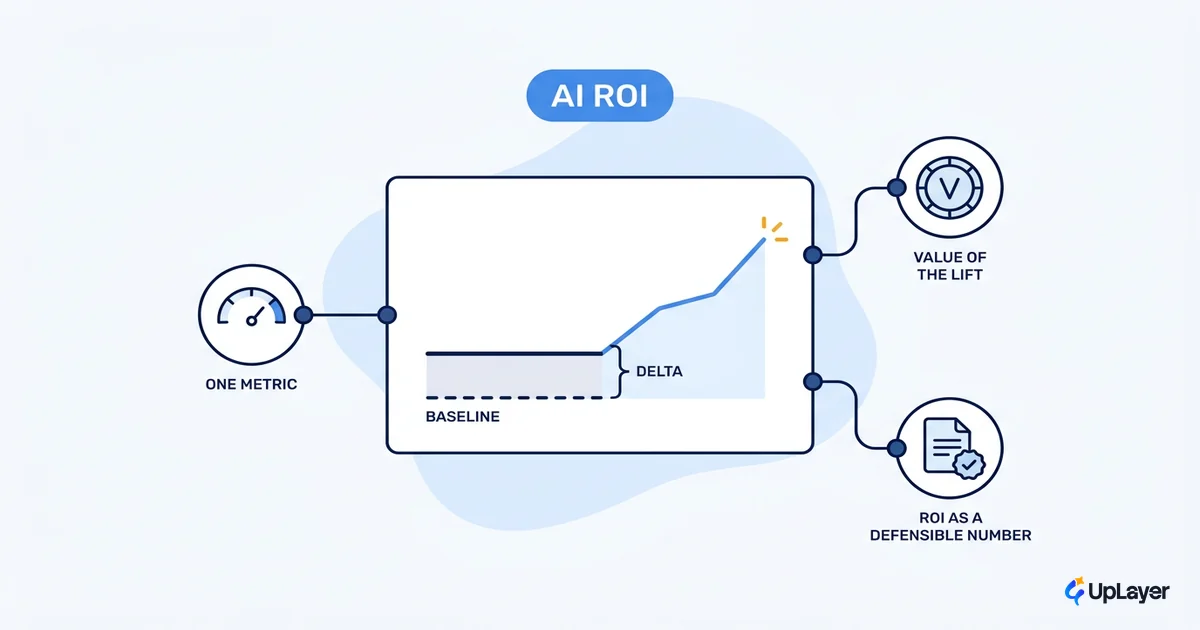
Most teams cannot report the AI ROI of the feature they just shipped. Not because the feature failed, but because nobody decided, before it shipped, which number it was supposed to move. So when leadership asks "what did it return?", the honest answer is "we don't know." The feature demos well, the dashboard looks busy, and the return stays a story instead of a number.
This piece is about turning that story into a number. The method is narrow on purpose: tie one AI feature to one metric you already track, set a baseline before you ship, and measure the delta. That is the whole discipline. Everything else here is the mechanics of doing it honestly. If you are still upstream of that, deciding which AI feature is even worth building, the same metric-first logic applies, only as a projection.
The good news: if you can measure churn, activation, conversion, or support volume today, you can measure the ROI of an AI feature. You already own the instrument. You just have to point it at one thing and hold it still.
What AI ROI actually means (and what it doesn't)
AI ROI is the change in one business metric, valued in money, minus the cost to build and run the feature, divided by that cost. That is it. It is a feature-level number, not a program-level mood.
The reason most "AI ROI" reporting fails is that it is measured at the wrong altitude. Teams try to value "our AI investment" across a dozen features, three teams, and a year of work. At that altitude, attribution is impossible and the resulting number is unfalsifiable. You can claim anything because nobody can disprove it. The fix is to shrink the unit of measurement until it is honest: one feature, one metric, one window.
This matters because the stakes are real. The IMF notes that generative AI has the potential to reshape the global economy, with advanced economies feeling the effects first. Real economic stakes are exactly why "trust me, it's working" is not good enough. If AI is going to move your business, you should be able to point at the line it moved.
NOTE
"Measuring AI ROI" and "measuring AI" are different jobs. The first is feature-level and answerable. The second is a program-level abstraction that almost never resolves into a defensible figure. Pick the first.
How do you measure the ROI of an AI feature
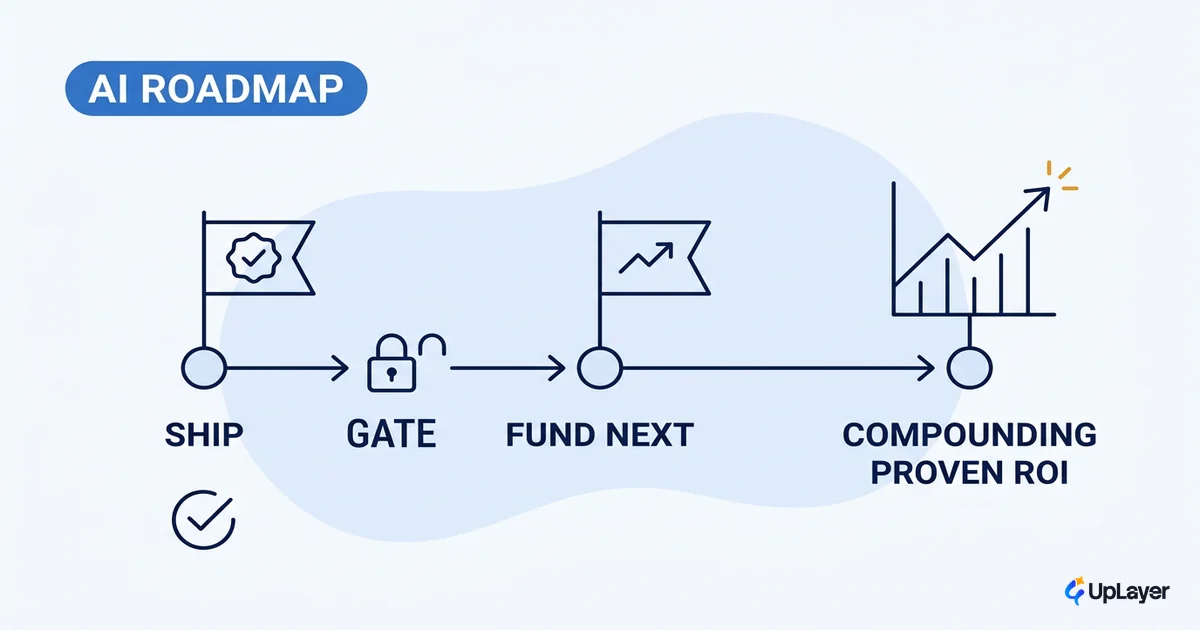
You measure it the way you would measure any change to your product: define the metric, capture the baseline, ship to a measurable slice, then read the delta and subtract what it cost to run. The only AI-specific part is resisting the urge to skip the baseline because the model felt impressive.
Here is the method, in order:
- Pick the metric you already track. Not a new metric invented for the feature. If the feature is a support copilot, the metric is ticket resolution time or deflection rate. If it is onboarding guidance, the metric is activation. Reusing an existing metric is what makes the number credible.
- Set a baseline before you ship. Measure the metric for a representative period with the feature off. Without this, you have no "before," and a delta needs a before. It is worth the discipline to set a baseline before the feature ships, even when it delays launch by a week.
- Ship to a measurable slice. A holdout group, a phased rollout, or a clean before/after window. You need a comparison that is not contaminated by seasonality or a concurrent pricing change.
- Value the delta in money. Convert the metric movement into revenue retained, revenue gained, or cost avoided. A two-point drop in monthly churn on a $40 ARPU base is a number you can write down.
- Subtract the run cost. Model inference, vendor fees, monitoring, and the human review the feature needs to stay trustworthy. ROI is net of what it costs to keep the feature alive, not just to build it. That reliability spend is not overhead to trim either; treating reliability as an AI ROI lever shows why an untrusted feature loses the adoption that the whole return depends on.
The cost of skipping this is well documented. Gartner predicts that at least 30% of generative AI projects will be abandoned after proof of concept by the end of 2025, citing escalating costs and unclear business value among the causes. "Unclear business value" is what happens when nobody set the metric and the baseline up front. The measurement discipline is not bureaucracy. It is the thing that keeps the feature from becoming a statistic.
How to calculate return on an AI feature
The AI feature ROI formula is the ordinary return-on-investment formula with the inputs named for a product context. There is nothing exotic about it.
AI feature ROI (%) = (Value of metric delta − Total cost) / Total cost × 100

where:
  Value of metric delta = (metric_after − metric_before) valued in money over the window
  Total cost            = build cost + run cost (inference, vendors, monitoring, human review)
This is the same structure as the ordinary return-on-investment formula used in finance: net return over cost. Naming the inputs is what makes it usable for a feature.
A worked, illustrative example (no real client, figures are projected for the sake of the math):
- A SaaS adds an in-product support copilot. Baseline: average ticket resolution time of 14 hours across 2,000 monthly tickets.
- After rollout to a measured slice, resolution time falls to 9 hours. The delta is 5 hours per ticket.
- Valued at a loaded support cost of $35/hour, that is 5 × 2,000 × $35 = $350,000/year in avoided cost.
- Build cost was $90,000; annual run cost (inference, monitoring, human review) is $60,000. Total cost = $150,000.
- ROI = ($350,000 − $150,000) / $150,000 × 100 = roughly 133% in year one.
The number is only as honest as the baseline behind it. Change the baseline, change the delta, change the ROI. That is why step two of the method is non-negotiable.
The AI ROI metrics that actually prove value
The AI ROI metrics that prove value are the ones already on your dashboard, mapped to the specific feature meant to move them. The test for "what metrics prove AI ROI" is simple: if you were not tracking the metric before the feature existed, it is probably the wrong metric. New metrics invented to flatter a feature are how teams launder a non-result into a win.
The discipline is matching the feature to the right metric, then valuing the movement consistently.
| AI feature | Metric it should move | How you value the delta |
|---|---|---|
| Support copilot / answer assist | Ticket deflection, resolution time | Support hours avoided × loaded hourly cost |
| Onboarding / setup guidance | Activation rate, time-to-value | Incremental retained accounts × ARPU |
| Churn-risk surfacing | Monthly churn rate | Accounts saved × annual contract value |
| In-app semantic search | Task completion, feature adoption | Reduced drop-off × expansion or retention value |
| Lead triage / scoring | Conversion rate | Incremental closed deals × average deal size |
Two rules keep the table honest. First, one feature maps to one primary metric. If a feature claims to move five metrics, you cannot attribute the movement to it, and an unattributable win is not a win. When the feature is an agent rather than a copilot, the same rule holds but the metric shifts toward completed-task value, which is why measuring agentic AI ROI prices the reliability tax instead of crediting autonomy on its own. Second, value the delta the same way every quarter. The moment you change the valuation method to keep the number green, you are writing fiction.
IMPORTANT
A metric you do not already track is a metric you cannot baseline. Measuring AI ROI against a brand-new metric means there is no honest "before," so the first reported delta is unverifiable by construction.
Projected ROI vs measured ROI
Projected ROI and measured ROI are different objects, and conflating them is the most common error in AI ROI reporting. Projected ROI is an estimate made before you build, used to decide whether to build at all. Measured ROI is the delta you read after the feature is live. One is a gate. The other is a verdict.
| Projected ROI | Measured ROI | |
|---|---|---|
| When | Before you build | After the feature ships |
| Purpose | Decide whether to build | Confirm whether it paid off |
| Inputs | Assumed delta, estimated cost | Observed delta vs baseline, actual cost |
| Honest about | Uncertainty (a range) | Result (a single window) |
| Failure mode | Optimism bias | Attribution error |
Projected ROI belongs in the decision, before code exists. It is worth learning to project the ROI before you write code, because a feature that cannot clear a credible projection should not be built. But a projection is a hypothesis, not a result. The discipline is to report it as a range, then return after launch and replace it with the measured number.
WARNING
Do not present projected ROI as if it were measured ROI. A projection is what you hope will happen. The measured number is what did. AI ROI dashboards lose all credibility the moment a stakeholder discovers the impressive figure was an assumption multiplied by an assumption.
Why most AI features never show their ROI
Most AI features never show their ROI because of process failures, not model failures. The model usually works. The measurement around it does not. Five failures account for nearly all of it:
- No baseline. The feature shipped before anyone recorded the "before," so there is no anchor to measure the delta against. This is the most common failure and the easiest to prevent.
- No holdout or clean window. The feature rolled out to everyone at once, in the same quarter as a pricing change and a marketing push, so the metric moved but nobody can say what moved it.
- The wrong attribution window. The team reads the metric a week after launch, before behavior settles, or a year after, by which point ten other things have changed. The window has to fit the metric: churn needs months, deflection needs weeks.
- A metric nobody tracked before. A new metric was created to describe the feature, which means there is no history to compare against and the first reading is unfalsifiable.
- Soft benefits that resist valuation. "Better experience" and "more modern product" are real, but if you cannot convert them into retained or gained revenue, they do not belong in an ROI number. Park them as qualitative notes, not as dollars.
Adoption is real and measurable when teams choose to measure it. The Federal Reserve, drawing on Census survey data, reports AI adoption at about 18 percent of US firms at the end of 2025. That is a concrete number because someone defined the question and tracked it over time. The same is possible at the feature level. The teams that cannot report ROI are usually the ones that never set up the comparison, not the ones whose AI did nothing.
The hardest part is the discipline at the end. If the measured delta is flat after a fair window, the feature did not pay off, and the honest move is to be willing to kill the feature and reclaim the run cost. This is the part the rest of the market avoids. Most AI content is uniformly enthusiastic, which is exactly why a real ROI of AI conversation has to include the features that move nothing. Measuring AI ROI properly means accepting that some of the numbers will tell you to stop.
A flat metric after a fair window is not a setback to spin. It is the measurement working. The feature told you the truth, and you got to learn it for the price of a run-cost, not a roadmap.
The measurement discipline does not slow you down. It is the only thing that lets you move fast without fooling yourself, because it replaces opinion with a delta you can defend in any review.
How long should you wait before reading the result
Read the result over a window long enough for the metric to settle, and no longer. The right window is a property of the metric, not the calendar. Reading too early rewards novelty effects. Reading too late lets unrelated changes contaminate the delta.
A practical mapping for measuring AI ROI cleanly:
- Deflection and resolution time: two to four weeks. Behavior stabilizes fast once users learn the feature exists.
- Activation and time-to-value: one to two full onboarding cohorts, so you compare like-for-like cohorts rather than a mixed crowd.
- Conversion: one to two sales cycles, so deals influenced by the feature have time to close.
- Churn and expansion: at least one billing period, usually a full quarter, because retention is a slow signal and a single month is noise.
Whatever the window, freeze it before you start. Choosing the window after you see the data is how a flat result quietly becomes a "promising trend." Decide the window when you set the baseline, write it down, and read the number when the window closes, not when it flatters you.
Define the metric before the model, hold the baseline still, and let the delta decide. Done that way, AI ROI stops being a quarterly argument and becomes a number you can stand behind, feature by feature, the same way you would defend any other product investment.
TIP
Want the projected ROI of your single highest-impact AI feature, scored against a metric you already track? How the AX Audit works.