AI copilot metrics that prove the feature works
AI copilot metrics most teams track measure usage, not value. Here is the four-layer model and the kill rule that tell you to double down or retire.
 Sohanur RahmanAI Copilots & Assistants7 min read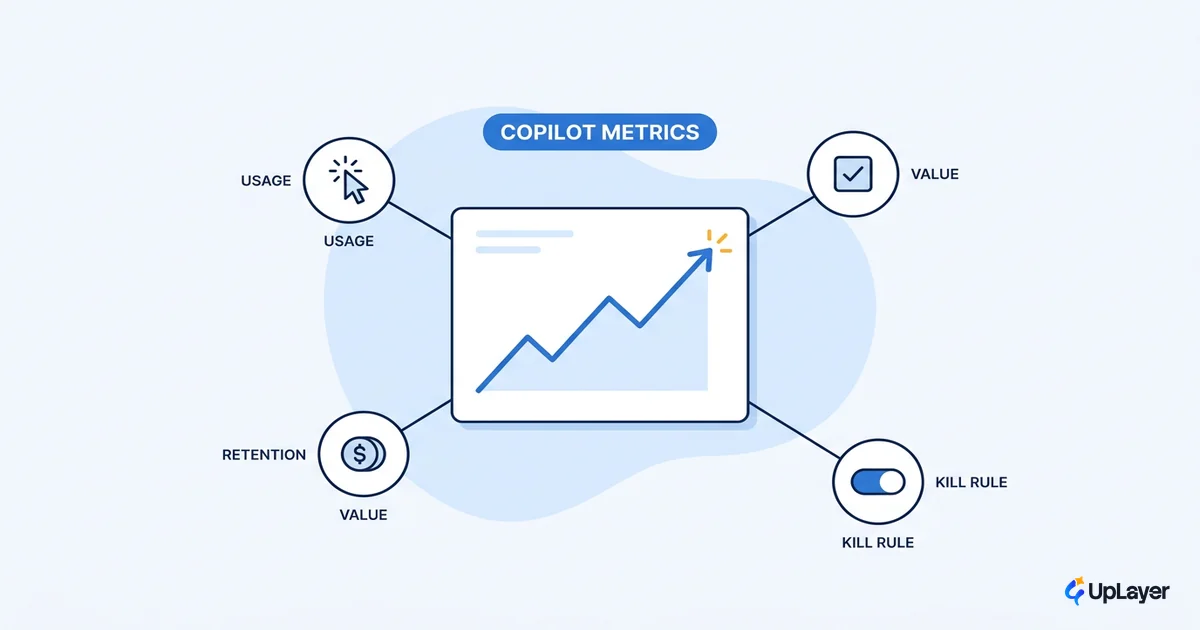
A copilot can have a beautiful usage chart and still be worthless. Most of the AI features that get quietly killed were used. People opened them, typed into them, accepted a suggestion or two, and the dashboard went up and to the right. Then renewal came around and nothing about the number on the board had changed.
That gap is the whole problem with how teams pick ai copilot metrics. Adoption looks like success, so it gets reported as success. But adoption is an input. The metric your board actually holds you to, retention or activation or expansion, is the output, and a copilot that touches the first without moving the second is a cost wearing the costume of a feature.
This is the measurement layer of the supportive AI thesis we apply to assistant design: build the layer that moves a number you already track, and instrument it so you can prove it or retire it. Here is the model we use, and the rule for when to walk away.
Most copilot dashboards measure the wrong thing
The citable answer first: usage metrics tell you a copilot is alive, not that it is working. Acceptance rate, messages per session, and weekly active users all measure the tool's internal motion. None of them measure whether the customer is more likely to stay, expand, or convert because the copilot exists.
This is not a small reporting quirk. It is the dominant reason AI work dies. Gartner projects that at least 30% of generative AI projects will be abandoned after proof of concept by the end of 2025, citing escalating costs and unclear business value among the top causes. Unclear business value is what happens when the only thing you measured was usage.
The trap is seductive because the vanity numbers are easy to instrument and they move early. You ship a product copilot, engagement climbs for three weeks, and everyone relaxes. The lagging number that pays the rent has not budged, and you will not notice until the quarter closes.
IMPORTANT
If you cannot name the metric your copilot is supposed to move before you read a single usage chart, you are not measuring success. You are watching a feature breathe.
The four layers of AI copilot metrics that actually matter
So how do you measure ai copilot success without fooling yourself? Stack the metrics in four layers and refuse to let a lower layer stand in for a higher one. Each layer answers a different question, and only the top one is the question your board is asking.
| Layer | Example metrics | What it tells you | The trap |
|---|---|---|---|
| Adoption | activation into copilot, % of accounts that try it, discovery rate | People can find it and start | A copilot nobody finds produces nothing, no matter how good the model |
| Engagement | repeat use, sessions per user, acceptance rate | The job is worth coming back for | High engagement on a job that doesn't matter is still noise |
| Outcome | task completion, time-to-value, error rate on the copilot's job | The copilot does its one job well | Doing a job well that no one needed |
| Business | retention, expansion, conversion, the metric you already report | The feature earned its place | This is the only layer renewal cares about |
The adoption layer is the gate. Nielsen Norman Group found that for many products, improving core UX brings higher return than shipping a copilot-style channel "that will get little use." Discovery and trust come first, or none of the upper layers ever get a reading. Most of that gate is won or lost in the first session, which is why copilot onboarding that gets the first action done is the work that makes the adoption number real instead of a one-time spike.
When you scope a copilot to one job it does well, each layer gets a clean signal instead of a blur. Here is the skeleton we wire up before launch:
copilot_scorecard:
  adoption:    activated_accounts / eligible_accounts        # gate
  engagement:  repeat_users_wk4 / activated_accounts          # is the job worth returning to
  outcome:     tasks_completed / tasks_started                # does it do the job
  business:    delta(retention | expansion | conversion)      # the metric you already track
# rule: a lower layer is NEVER reported as success for the layer above it.
# verdict = business delta, attributed to copilot-exposed cohort vs control.
The discipline is the last line. You attribute the business delta to a cohort that used the copilot against a comparable cohort that did not. Without the comparison, you have a number and a story, not proof.
Leading signals vs lagging proof
The reason teams confuse usage with value is timing. Leading signals arrive in week two. Lagging proof takes a quarter. So the easy, early numbers get the attention and the slow, real number gets ignored until it is too late to act on.
Read them as two different jobs. Leading signals (activation, repeat use, task completion) tell you the copilot is on a path to move a metric. Lagging proof (retention, expansion) tells you it actually did. The developer-tool world has the best-instrumented example of a leading signal: GitHub found that developers completed tasks 55% faster with Copilot, and that 75% felt more fulfilled using it.
Those are excellent leading numbers. They are not business metrics. Faster task completion is a strong predictor that retention or expansion will follow, but it is the predictor, not the proof. Treat it as the thing that earns the copilot a few more weeks to show up in the lagging layer, not as the verdict itself.
TIP
Wire your leading signals to a specific lagging metric with a stated hypothesis: "if activation into the copilot clears 40% and repeat use holds, we expect a 2 to 3 point retention lift in the exposed cohort by Q2." Now the early number means something, because it is a bet you can settle.
What metrics prove a product copilot is working
This is where the outcome and business layers do their work. A product copilot is working when the cohort that uses it behaves measurably better on a metric you already report than the cohort that does not. Not when usage is high. When the number on the board moves.
In one survey, 75% of developers said they felt more fulfilled when using GitHub Copilot, and 46% of code in enabled files was completed by the tool. Strong outcome signals. The business question is still whether those developers renewed, expanded, or referred at a higher rate.
Make the connection explicit. Take a support-triage copilot inside a B2B SaaS product. The outcome metric is time-to-resolution on the tickets the copilot touches. The business metric is logo retention among accounts whose teams use it. In a Concept Demo we built to show this thinking, the projected path looks like this: activation into the copilot at 45% of seats, repeat use holding through week four, time-to-resolution down by a projected 30%, and a projected 2 to 4 point retention lift in the exposed cohort over two quarters. Projected, attributed to a cohort, framed as a bet, never claimed as an achieved result.
That is the standard. The work of building AI copilots that move a metric, not a demo, is mostly the work of deciding which business metric you are accountable for before you write the prompt. Measurement is just that decision, made visible.
When should you kill an AI copilot
Now the part most content avoids. You should kill a copilot when it is used but moves nothing, and you should do it without sentiment. Usage is not a reason to keep a feature. A moved metric is. A copilot that costs inference, support, and attention while the business layer stays flat is a tax you are paying to look modern.
The market is already making this call at scale. Gartner projects that over 40% of agentic AI projects will be canceled by the end of 2027, again citing escalating costs and unclear business value. The teams that cancel early and cleanly are not the ones that failed. They are the ones that measured.
Here is the decision matrix. Run it every quarter against the lagging layer, not the leading one.
| Signal | Business metric | Verdict |
|---|---|---|
| Used, business metric up | retention or expansion moved | Double down. Fund the next opportunity |
| Used, business metric flat | engagement fine, no lift | Fix the job or change the metric, then set a deadline |
| Barely used after activation push | no reading on outcome | Retire fast. The adoption gate failed |
| Strong projected ROI, never instrumented | unknown | Stop. Instrument before you spend another sprint |
WARNING
The most expensive copilot is the one that is used just enough to feel successful and never moves the number. It survives review after review on engagement charts while the lagging metric tells the truth nobody is reading. Set the kill threshold before launch, in writing, or you will rationalize past it every time.
The expansion line on that matrix is where many copilots finally earn their keep, which is why packaging that drives expansion belongs in the measurement conversation, not after it. A copilot that lifts retention is good. One that also opens a clean projected roi path through expansion is a feature worth doubling down on.
The honest version of this work is unglamorous. You instrument the copilot before it ships, you state the business metric and the kill threshold up front, and you let the lagging layer render the verdict on schedule. Pick your ai copilot metrics so that the answer is already wired the day you launch, and the decision to double down or retire makes itself.
TIP
Want the four-layer scorecard built for your product, with the metric, the kill threshold, and the projected lift defined before you ship? How the AX Audit works.