How to measure if an AI feature actually worked
Measuring AI feature impact is a before-after read on one metric, not a vibe. The post-launch loop that proves a feature moved the number you promised.
 Shahriar P. ShuvoAI for SaaS & Features7 min read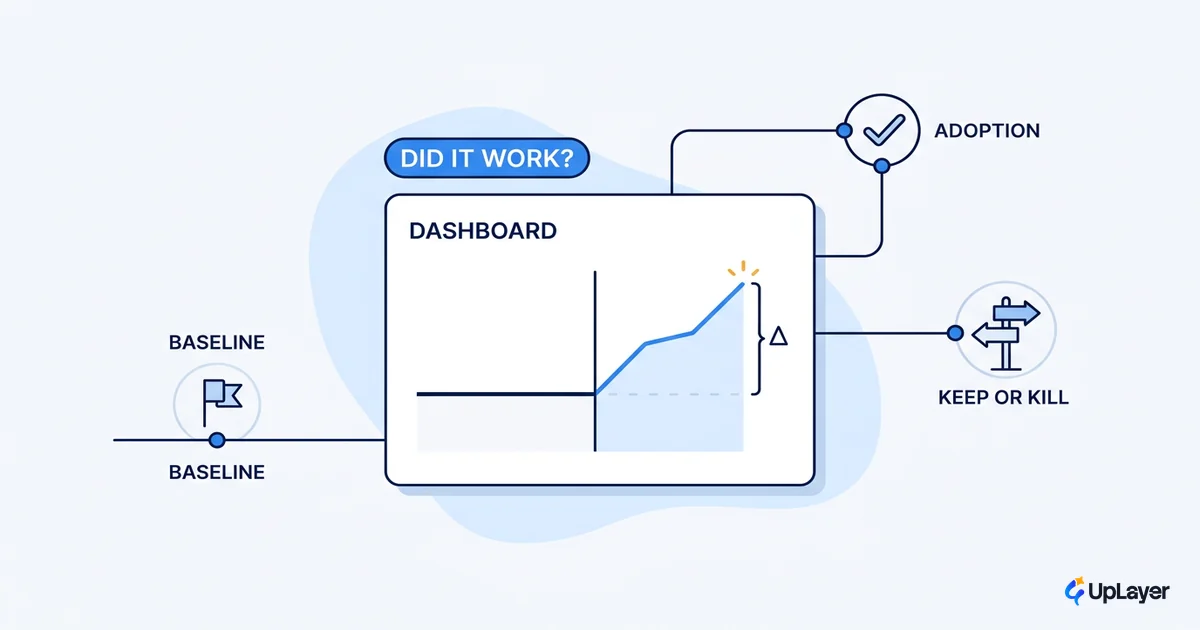
The feature shipped. The demo looked great. Then, three weeks later, someone in a meeting asks "did it work?" and the room goes quiet. Nobody has a number. They have screenshots, a few nice quotes from a Slack channel, and a vague sense that usage is "up."
That silence is the real problem. Shipping an AI feature is the easy half. The hard half, the half almost nobody does well, is measuring AI feature impact: proving the thing moved the metric you said it would. It is not a vibe and it is not a story. It is a before-after read on one number you already track. This post walks the post-launch loop that produces that number, from the baseline you should have captured before launch to the keep-fix-or-kill decision at the end. If you want the method for projecting the return in the first place, that lives in our cornerstone on how to measure the ROI of an AI feature; this is the sequel, where the feature already exists in production and you find out whether the projection was true.
The stakes are not abstract. According to Boston Consulting Group, only 26% of companies have built the capabilities to move past proofs of concept and generate tangible value from AI. Most of the rest are stuck in exactly that quiet room.
Measuring AI feature impact starts before you ship
You cannot read a delta against nothing. The first rule of measuring AI feature impact is that the measurement begins before launch, when you capture the metric's current value and its trend.
A baseline is a snapshot plus a slope. If activation is sitting at 41% and has drifted up roughly a point a month on its own, then a post-launch reading of 43% is not a win. It is the trend you already had. Without that pre-launch capture, every number after launch is unanchored, and you end up arguing about whether the feature helped instead of reading whether it did. Capture the metric, the date, and the trailing trend, and write them down before anyone touches the launch toggle. We go deeper on this in the guide to set a baseline before you ship, because it is the step teams skip and regret.
This is also where the projected roi you wrote during planning becomes useful. The projection was a hypothesis: "this feature will lift activation by four points." The baseline is what you test that hypothesis against. Keep the projection visible. It is the bar.
Separate two questions: did people use it, and did it move a metric
Adoption and impact are two different reads, and conflating them is how teams talk themselves into keeping a feature that does nothing.
A feature can have high ai feature adoption and move no business metric at all. People click it, enjoy it, and churn at the same rate they always did. The reverse also happens: a feature reaches only 8% of users but moves the metric hard for that slice, which tells you the real problem is distribution, not the feature. You learn none of this if you track a single blended number. Instrument adoption (who reaches the feature, who uses it, how often) separately from impact (what happened to the metric for users who adopted it versus those who did not).
This separation matters because unmeasured features get cut. Gartner predicts at least 30% of generative AI projects will be abandoned after proof of concept, and unclear business value is one of the named reasons. A feature with strong adoption and a clear metric story survives that review. A feature that "feels useful" does not. Many AI features ship and move nothing, and the only way to tell them apart from the ones that work is to measure both reads.
What metrics prove an AI feature worked?
The metric that proves an AI feature worked is the one your team already tracked before the feature existed, tied to the outcome the feature was supposed to change. This read is only clean when the metric was chosen at planning time, which is why the features that survive launch are the AI product features picked to move a number before the spec was written.
Do not invent an "AI engagement score." Pick from the metrics you already report to the board: activation, retention, conversion, time-to-value, support deflection. The Nielsen Norman Group makes the same point about measurement generally: rigorous reads come from a small set of comparable metrics like task success and time on task, captured the same way before and after, so the difference is real and not an artifact of how you counted. Match the feature type to the metric it should move, and decide the read window up front.
| Feature type | Metric it should move | Read window | Common false positive |
|---|---|---|---|
| Onboarding copilot | Activation rate | 2-4 weeks | New-user mix shifts that week |
| In-app answer / search | Time-to-value, ticket deflection | 4-6 weeks | Seasonal support volume |
| Smart suggestions | Feature adoption, retention | 6-8 weeks | Power users only, no breadth |
| Generated drafts | Conversion, task completion | 2-4 weeks | Novelty spike, then decay |
The read window is not optional. AI features often show a novelty spike in week one and settle by week four, so a metric read on day three is noise. Pick the window when you set the baseline, not after you see a number you like.
How do you measure AI feature impact without fooling yourself?
You measure honestly by comparing users who got the feature against a group who did not, over the window you fixed, and by naming every other thing that changed in that window.
The trap is attribution. If you shipped the AI feature the same sprint you fixed a slow page and ran a pricing test, the metric moved for three reasons and you cannot hand the credit to one. The cleanest read is a holdout: a slice of users who do not get the feature, so the rest of the product is held constant between the two groups. Harvard Business Review's account of controlled experiments at Microsoft is blunt about why this matters: even experts have a hard time assessing new ideas. A small Bing headline change that managers shelved as low-priority turned out to be one of the largest revenue ideas in the company's history, and only a controlled test revealed it. Intuition is not a measurement.
Here is the read, as a checklist you can run:
AI feature impact (per metric)
==============================
delta        = metric[adopted, after] - metric[adopted, before]
trend_adjust = baseline_slope * weeks_elapsed
true_lift    = delta - trend_adjust

attribution check:
  [ ] holdout or matched cohort exists
  [ ] read window fixed before launch (not chosen after)
  [ ] no other major change shipped to this cohort in-window
  [ ] novelty period excluded from the read
  [ ] sample large enough to clear normal week-to-week noise

VERDICT: true_lift clears noise AND attribution check passes -> real
NOTE
AI features add wrinkles a button-color A/B test does not have. Output is non-deterministic, so two users asking the same thing get different answers, and quality varies. Models drift as providers update them, so a feature that read well in March can quietly degrade by June. Build a recurring read, not a one-time launch report.
If you cannot run a holdout, a clean before-after on a matched cohort, trend-adjusted, is the next best thing. The point is the same: subtract what would have happened anyway, then see what is left.
How do you prove AI ROI after launch?
You prove AI ROI after launch by converting the true metric lift into the same unit as the cost: money. The lift is in metric points; finance thinks in currency and run cost.
Translate the delta. If activation rose four real points and each activated account is worth a known amount in expansion or retention, that lift has a dollar figure. Set it against what the feature costs to run: inference, monitoring, and the engineering time to keep it reliable. That ratio is the return, and it is the number that ends the quiet meeting. Amplitude frames the discipline well: a North Star metric holds product teams accountable for an outcome, not for how much they ship. An AI feature is not an outcome. The metric it moved is.
TIP
When you do not yet have enough live data, present the read as projected and label it. A Concept Demo with a projected lift against a real baseline is honest and persuasive. An invented success metric is neither.
Keep, fix, or kill: deciding on the number
The loop exists to serve one decision, and the decision is rarely "celebrate." It is keep, fix, or kill.
If the true lift clears the bar and the cost ratio holds, keep it and move to the next opportunity. If adoption is strong but impact is flat, the feature works and the metric was wrong, so fix the target. If impact is real but reaches almost nobody, the build is fine and distribution is broken, so fix the surface. And if the number did not move after a fair read over a fair window, the honest move is to kill a feature that is not paying off and reclaim the run cost. Saying no to a feature you already shipped is uncomfortable. It is also the discipline that separates the 26% from everyone stuck in the quiet room.
Measuring AI feature impact is not a reporting chore you bolt on at the end. It is the loop that decides which features survive and which ones quietly drain budget, and it starts with a baseline and ends with a number a CFO accepts. Build the loop once and every future AI feature inherits it, which means the next time someone asks "did it work?" you answer in one sentence with a real figure instead of silence.
TIP
Want the baseline, the holdout, and the projected return mapped to one metric you already track, before you write a line of code? How the AX Audit works.